Understanding the Recommendations
When the Recommendation Engine reports its findings, notice the features of the interface and the actions you can now perform.
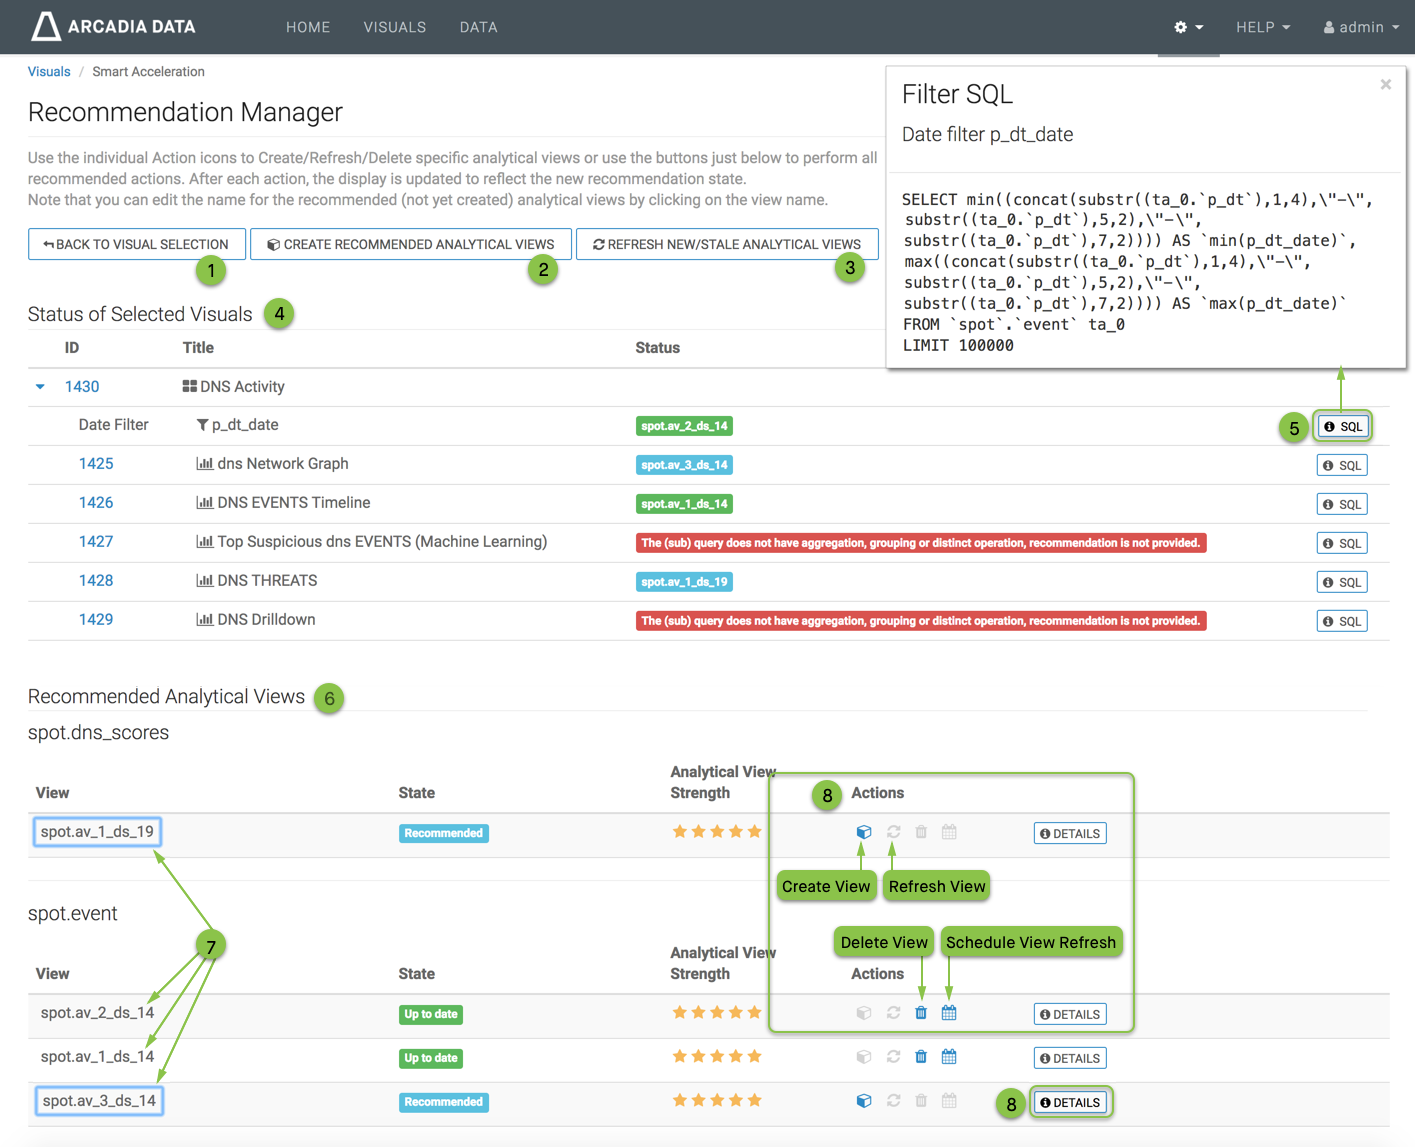
- To choose another dashboard, click Back To Visual Selection.
- To start implementing the advice of the Recommendation Manager, click Create Recommended Analytical Views.
- To ensure that the analytical views are ready to use, click Refresh New/Stale Analytical Views.
- Status of Selected Visuals table shows the ID and Title of each visual and filter in the dashboard, the Status of the recommendation (green for 'existing', blue for 'recommended', red for 'not provided'), and the clickable link for SQL.
- To see the SQL definition of each artifact on the dashboard, click the corresponding SQL option in the Status of Selected Visuals list. Here, we are showing the SQL definition of the date filter p_dt_date.
Recommended Analytical Views table shows both existing and recommended analytical views, and has the following information columns:
- State (Up to date, Stale, Needs initial refresh, Invalid, or Recommended)
- Analytical View Strength, a scale of 0 to 5 stars, from week to strong
- Actions available for analytical views
- Details
Note that when dashboards use multiple base tables, the recommendations group accordingly.
- You may rename the recommended analytical views by double-clicking on the name. This is not possible for existing analytical views.
-
The available Actions for each analytical view appear on each status line. They are:
- Create view
- Refresh view
- Delete view
- Schedule view refresh
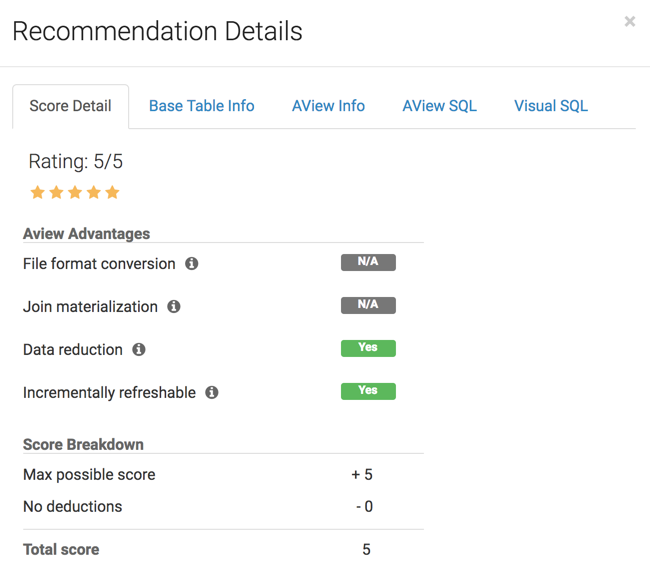
You can see analytical view definitions in the Recommended table by clicking Details. It has several tabs with information about the recommended view, the base storage structures, and the requesting query (either the visual or the filter). See the following sections:
Score Detail
The Score Detail explains the rating of the analytical view:
- Aview Advantages
- File format conversion
Analytical views are always in parquet format. If original data is not in parquet format, then converting to an analytical view applies parquet's default compression techniques.
- Join materialization
Join computations are cached, eliminating the need to perform join computations after query routing.
- Data reduction
Aggregation functions can result in data reduction. Analytical views cache the results after aggregation, eliminating to perform these computations after query routing.
- Incrementally refreshable
If analytical views are partitioned, they can be incrementally refreshed. Only the partitions containing stale data will be refreshed, leaving the valid partitions untouched.
- File format conversion
- Score breakdown
The following elements indicate how Arcadia Engine determines the score of the analytical view:
- Max possible score
This number is 5.
- Deductions / No Deductions
This number is subtracted from the maximum score.
- Total Score
This number represents the final rating after applying deductions.
- Max possible score
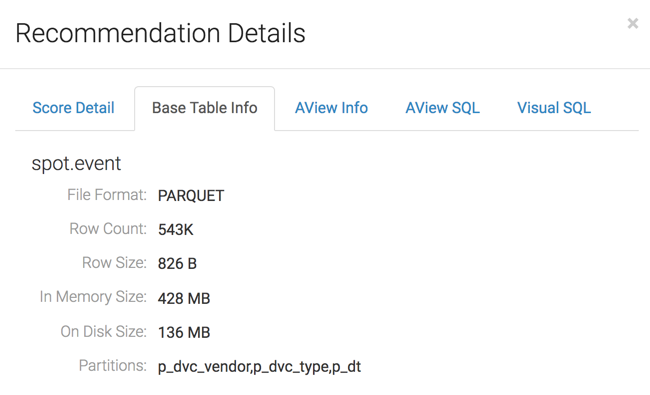
Base Table Info
This tab details the information about the base table of the analytical view.
- Table Name
- The name of the table appears in the form
database_name.table_name - File Format
- Format of the table, such as
TEXT,PARQUET, orKUDU - Row Count
- Number of rows in the table
- Row Size
- Typical size of each row, in Bytes
- In Memory Size
- The size of the table when stored in memory, in Bytes
- On Disk Size
- The size of the table when stored on disk, in Bytes
- Partitions
- The names of the columns that partition the table; can be none or several
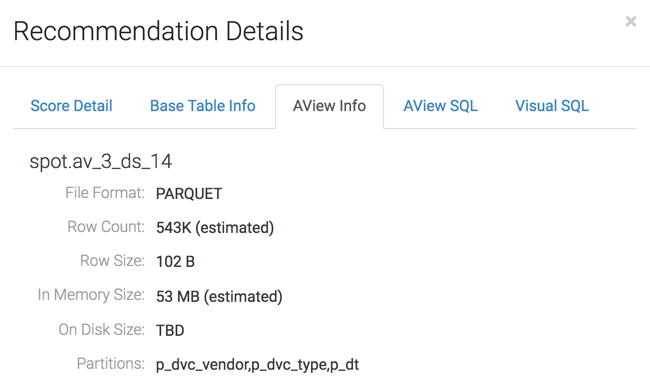
AView Info
This tab lists the information about the analytical view.
- Aview Name
- The name of the analytical view appears in the form
database_name.aview_name - File Format
- Format of the analytical view, such as
PARQUET - Row Count
- Number of rows in the analytical view; on recommended analytical views, this number is an estimation
- Row Size
- Typical size of each row, in Bytes
- In Memory Size
- The size of the analytical view when stored in memory, in Bytes; on recommended analytical views, this number is an estimation
- On Disk Size
- The size of the analytical view when stored on disk, in Bytes; on recommended analytical views, this number is not available, so we report is as To Be Determined (TBD)
- Partitions
- The names of the columns that partition the analytical view; can be none or several
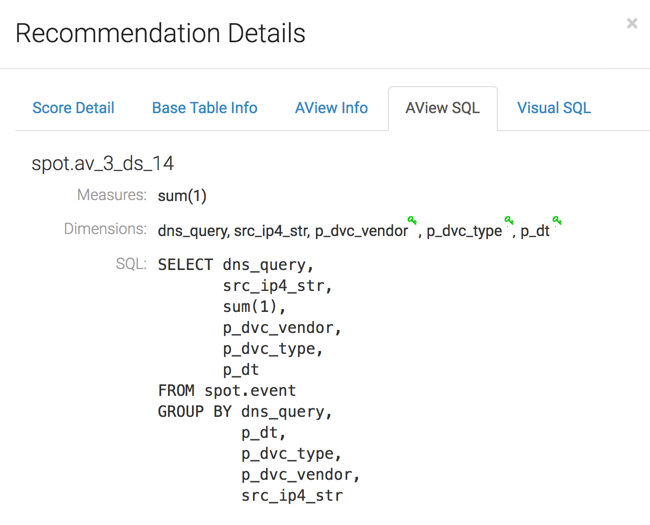
AView SQL
This tab provides the definition of the analytical view.
- Aview Name
- The name of the analytical view appears in the form
database_name.aview_name - Measures
- Measures used in analytical view; these are typically aggregations, such as
sum(1) - Dimension
- Dimensions used in analytical view; dimensions that match a partitioning column have a green key icon.
- SQL
- The SQL
SELECTstatement that defines the analytical view
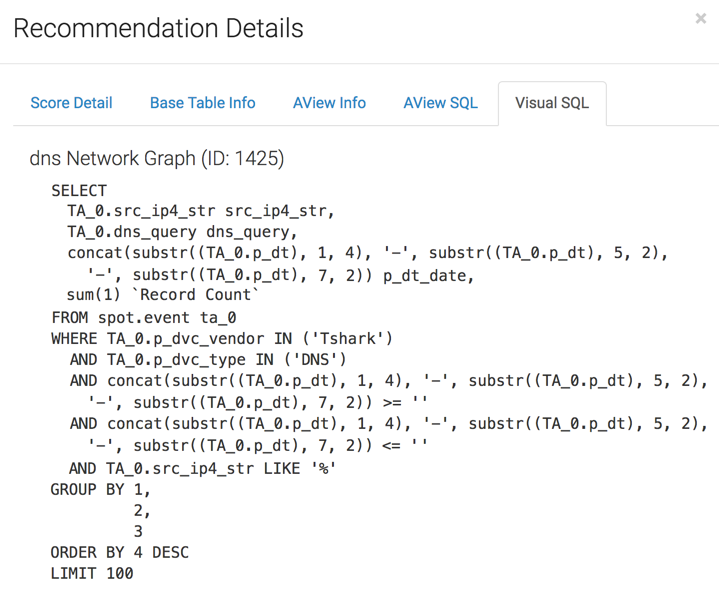
Visual SQL
This tab references the visual that generates the query, and shows its definition, as
a SELECT statement.
- Name of the Visual and its ID
- The name of the visual that originates the query request, and its ID, in the form visual_name (ID: visual_id)
- SQL
- The SQL
SELECTstatement that defines the visual
Proceed with Create Analytical View.