Using Relative Dates Mode
In Arcadia Enterprise, the relative date mode in a date filter enables you to select a subset range of dates anchored to a particular date.
This article describes how to use relative date mode in a calendar heat map visual.
In the following example, we demonstrate how to anchor a date to 2015-01-01 and limit the visual output to next two years from this date.
The following steps use a calendar heat map visual, which is built on the dataset Food
Stores Inspection in NYC.
- In the Visual Designer, in the left menu area, click the New Visual tab.
-
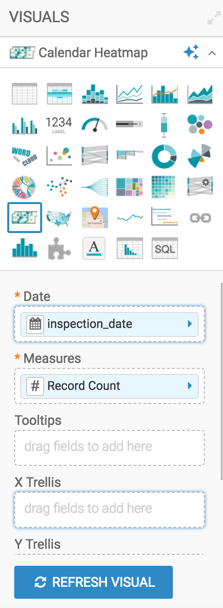
In the visuals menu, find and click Calendar Heatmap. Make sure you select the
Food Stores Inspection in NYC.dataset. - Under Dimensions, select
inspection_date, and drag and drop it to the Date shelf of the visual. - Under Measures, select
Record Count, and drag and drop it to the Measures shelf of the visual. - Click Refresh Visual.
-
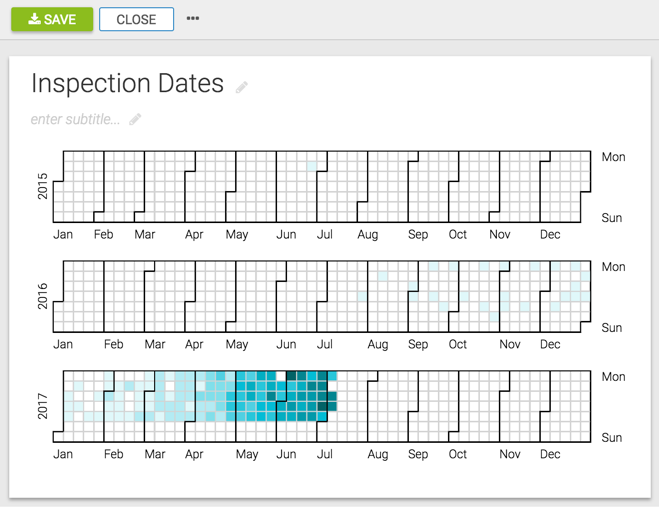
Note that the calendar heatmap visual appears in the main area of the interface with inspection dates for three years: 2015, 2016, and 2017.
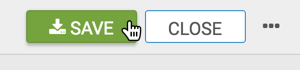
At the top left corner of the Visual Designer, click Save.
- Click Close.
- In the Dashboard Designer, click the Filters tab.
Under the Dimensions category, click the
Note that this adds a filter to the dashboard. This filter is based directly on the fieldinspection_datefield.inspection_date, and has a typetimestamp.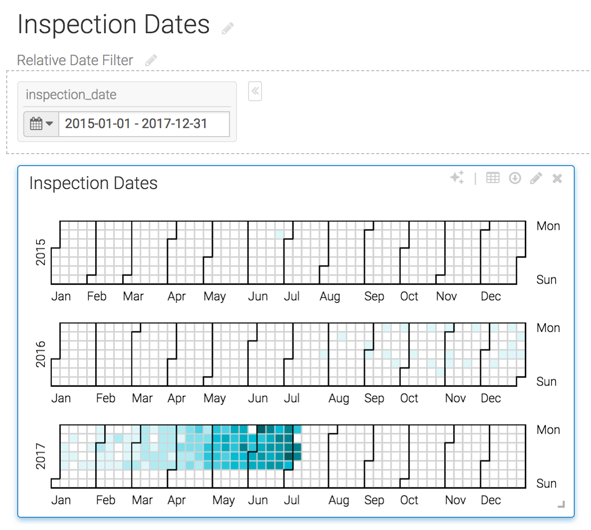
-
Note that the dashboard filter contains the date range for the entire dataset; in this case, it is for three years from 20015-01-01 through 2017-12-31.
-
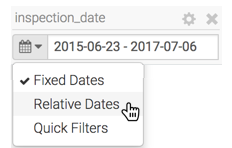
On the filter, click the (calendar) icon, and select the Relative Dates option from the menu.
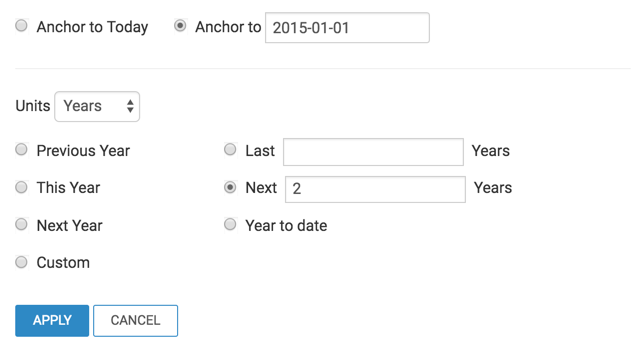
- The Relative Date modal window appears. Let us anchor the date to
2015-01-01 and limit the visual output to next two years from this date. Select the
following anchor:
- Anchor to. To specify an anchor, click in the edit field and select a date from the calendar interface. We selected 2015-01-01.
- The other option is Anchor to Today (default).
- Under Units select Years.
The other options are Days, Weeks, Months, Quarters.
- Check Next and enter 2 in the edit box.
The other options are Previous Year, This Year, Next Year, Custom, Last <number>Years, Year to date.
- Click Apply.
-
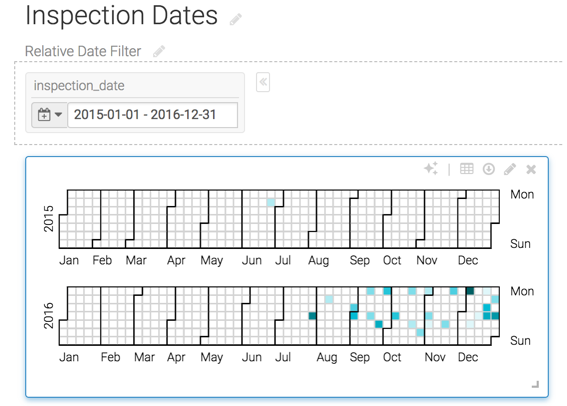
Note that the visual output is now limited to two years, starting from the anchor year of 2015, and that the application filter shows the new date range of 2015-01-01 - 2016-12-31.
- Name and save the application.