Visual Builder for Visuals
The Visual Builder Interface enables you to build visuals and dashboards in Arcadia Enterprise.
The following illustration is a basic Visual Builder interface for visuals.
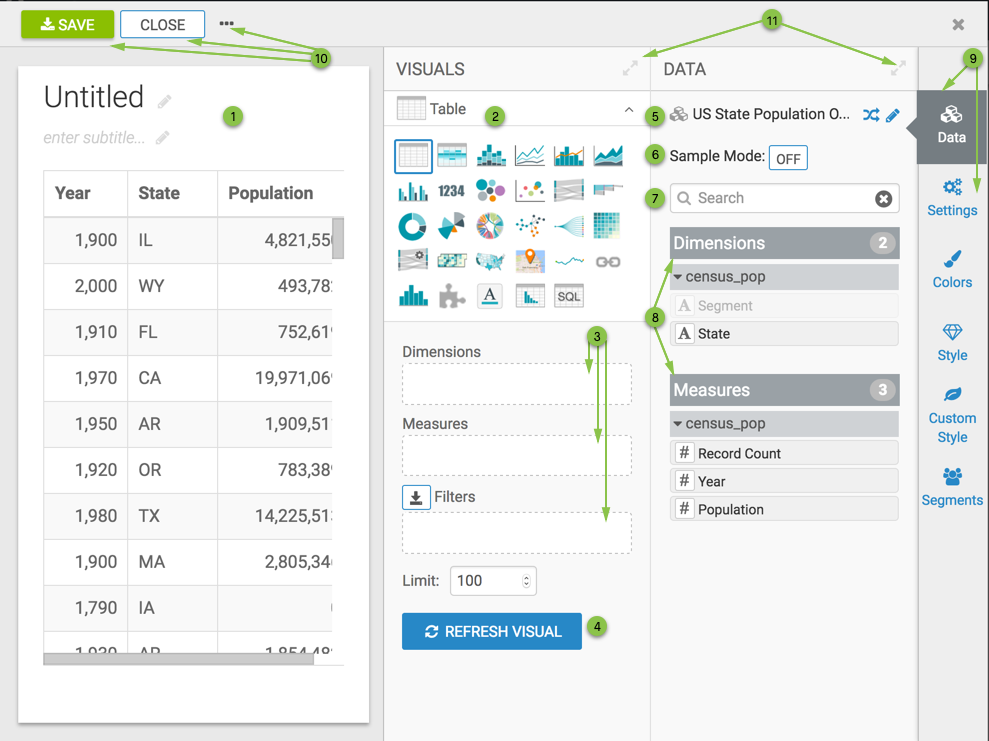
- Visual Preview pane shows the actual visual. At this stage, this is the default table type that lists all fields in the dataset. This pane also shows the editable Title and Subtitle of the visual.
- Visual Type Catalog menu shows the standard visual types. You can switch between visual types, such as tables, areas, bars, and so on, simply by selecting a different visual type in this menu. See Visual Type Catalog.
Shelves of the visual specify the fields and segments that provide the data to the visual. Different visual types require specific information, and have somewhat different shelves. The table visual has the following shelves: Dimensions, Measures, Filters, and Limit . In contrast, the shelves of the bars visual are: X Axis, Y Axis, Colors, Tooltips, and Filters.
To populate the shelves, drag-and-drop the fields from the Data menu. When a shelf is active (selected), you can add multiple fields simply by clicking on each of them in the Data menu.
- The Refresh Visual button re-draws the visual. Click it after changing the contents of the shelves, or the visual type.
- The name of the Dataset is at the top of this menu; you can click to change the dataset of the visual, or click to open the dataset definition in a new browser tab, and make any necessary changes that are immediately reflected in the options for the visual.
- The Sample Mode option is available only on Arcadia connections. It enables you to draw the visuals based on a sample subset of the data, defined as a percentage of the whole data. Turning it on makes the rendering of the visuals faster when developing them for very large sets of data, but we recommend turning this feature off in production environments. By default, sampling is turned off.
- The Search functionality helps you find the relevant columns in datasets with a large number of columns.
-
The Dimensions and Measures sections list all fields of the dataset. You must place them on the Shelves to specify the visual. If the dataset models a join of two or more tables, you may notice that the fields are grouped with their source data table. Note that this dataset contains a single source table,
census_pop. Menu Selector enables you to switch between the primary menus:
- Data (default)
- Settings
- Colors
- Style
- Custom Style
- Segments.
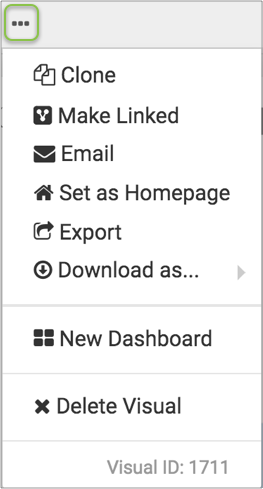
The top bar contains the Save button, the Close button, and a supplementary menu,under the (ellipsis) icon, which includes the following actions:
- Clone
- Add to Favorites
- Set as Homepage
- Download as..., with options for Image (png), PDF, and CSV
- New Visual
- New Dashboard
- Save Tables
- Delete Visual
The bottom of the menu displays the Visual ID, which you can use to debug performance issues. The ID appears in both View and Edit mode.
-
At the top right corner of the Visuals menu, or any open pane, click the (expand) icon to increase its width. To shrink the size of the pane, click the (compress) icon.