Managing Analytical Views in the User Interface
Analytical Views may be monitored and managed through the Arcadia Enterprise interface.
After familiarizing yourself with the interface, proceed to learn about the following tasks:
- Creating Analytical Views
- Refreshing Analytical Views
- Scheduling Analytical View Refresh
- Deleting Analytical Views
- Understanding the Details of the Analytical View
To navigate to the Analytical Views interface, follow these steps:
On the main navigation bar, click Data.

The Data view appears, open on the Datasets tab.
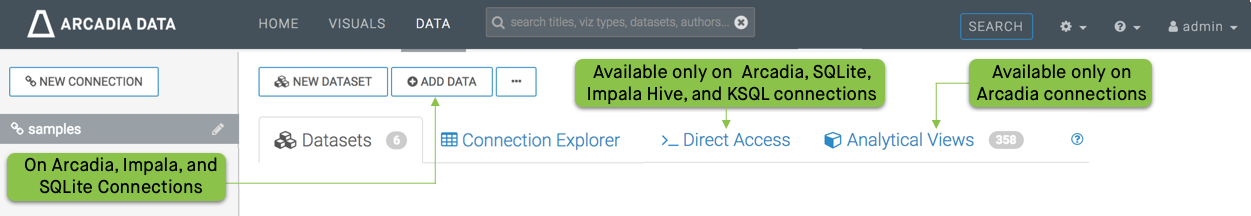
Click the Analytical Views tab.
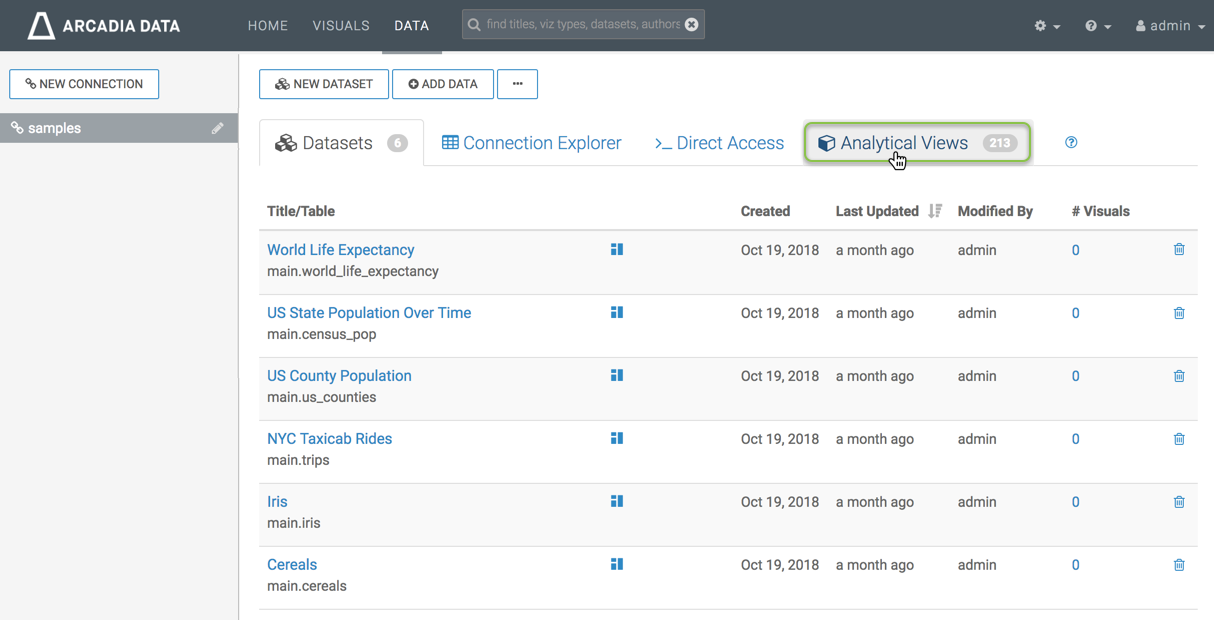
Accessing the List of Analytical Views The list of analytical views appears.
The Analytical Views Interface
The analytical views interface provides most of the management functions for analytical views, including the definition of analytical views, described in Creating Analytical Views in User Interface.
Note the elements of this interface, in Grouped Table view:
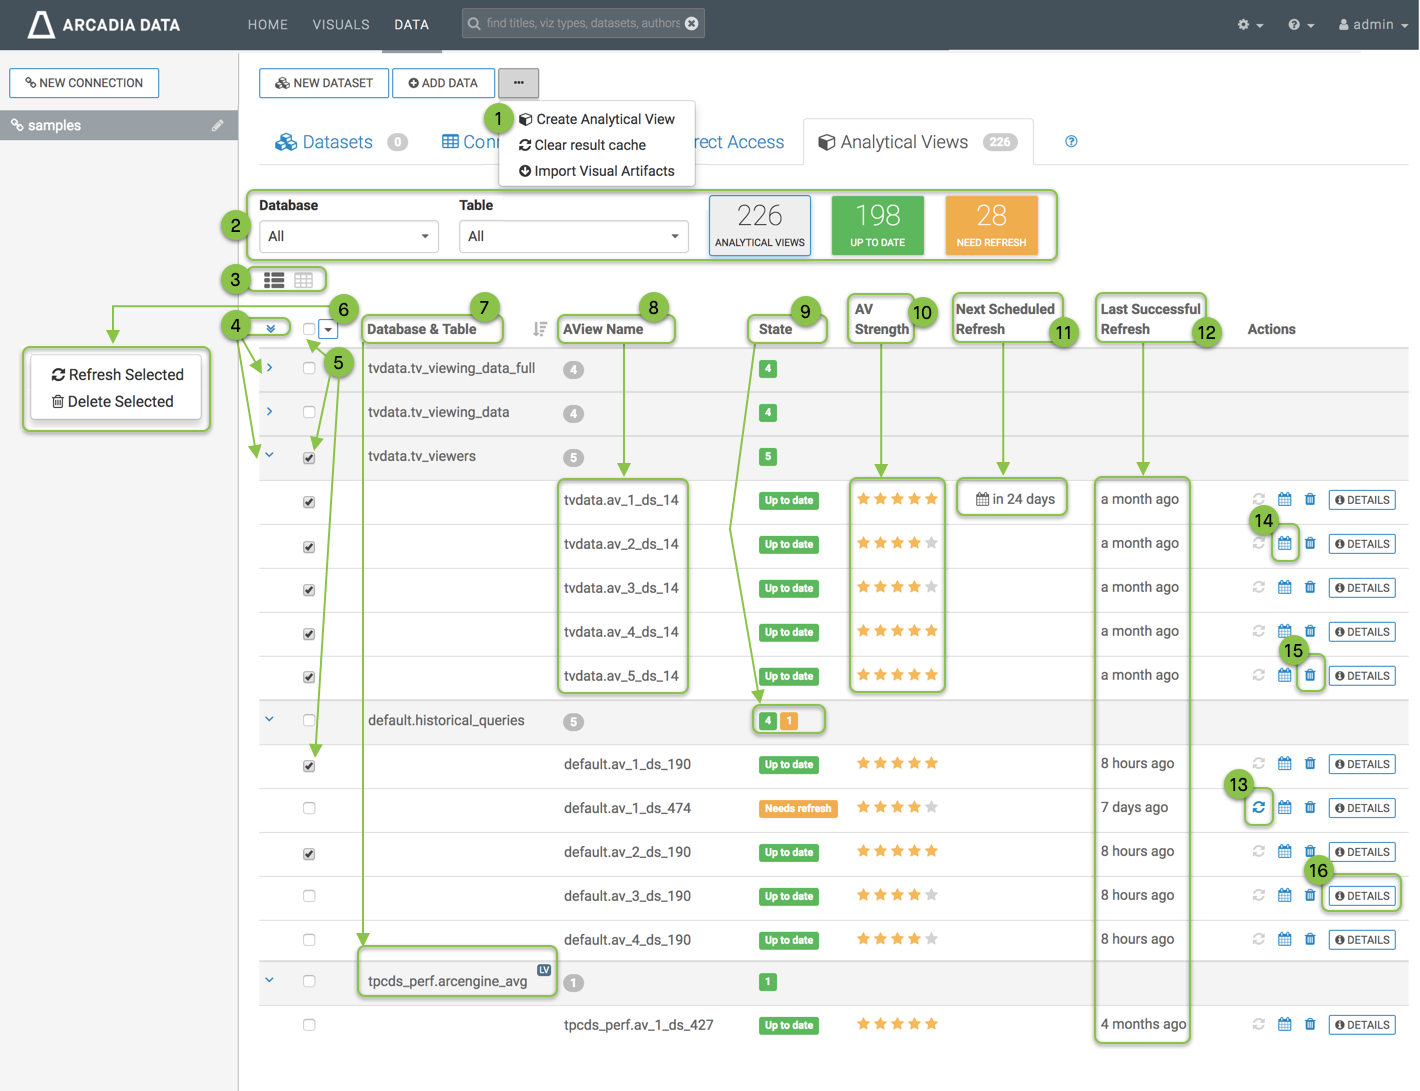
- Create Analytical View
Click the (supplemental menu) icon, and select Create Analytical View. See Creating Analytical Views in the User Interface.
- Filters
The quick filters at the top of the Analytical Views interface enable you to limit the list of analytical views by Database or Table. You can also filter by status of analytical view, which lists the number of analytical views that are in a specific state. Here, all existing analytical views are in either Up to Date state, or in Need Refresh state. See Filtering Analytical Views.
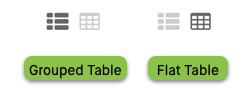
- View Option
You can toggle between the Grouped Table and Flat Table views:
- Grouped Table
All sorting is limited to the analytical views for a particular table.
-
Flat Table
The sort applies to all selected analytical views on all databases and tables of the connection.
Viewing Options for the Analytical Views Interface - Grouped Table
- Expand/Collapse All
In Grouped Table view, this toggle either expands all tables to show the analytical views, or collapses the list to show only the table and table-level information about analytical views. Note that each table has its own Expand/Collapse option.
- Select All
You can select all analytical views at the same time, and then perform one of the available bulk actions. Note that each table and analytical view has its own selection box. Selecting a table automatically selects all of its analytical views.
- Bulk Actions
After selecting analytical views, you can perform one of the bulk actions:
- Refresh Selected
Clicking the icon (refresh) refreshes all selected analytical views.
- Delete Selected
Clicking the (trash) icon brings up the Delete confirmation modal window to confirm the removal of all analytical views.
- Refresh Selected
- Database & Table
This column lists the database and base table (or logical view) over which the analytical view is defined, in the form
database_name.table_name.Notice that in Grouped Table view, this information appears on a grey background, while the Aview Name information is on white background.
If the table is a Logical Table, we use an LV marker.
-
AView Name
This columns lists the name of the analytical view, as
database_name.aview_name. By default, the interface groups all analytical views by table.The default naming convention for
aview_nameis.av_n_ds_m, wherenis the sequential order in which the analytical views are created, andmis the id of the dataset.Notice that in Grouped Table view, this information appears on a white background, while the Database & Table reports the number of analytical views, on grey background.
-
State
The state of the specific view. Possible values are indicated by Up to date (equivalent to
FRESH), Invalid, Needs refresh, and Needs initial refresh.In Grouped Table view, each table summarizes this information. For example,
default.historical_querieslists the count of 4 on a green square, which corresponds to Up to date, and 1 on an amber square, which corresponds to Needs Refresh. - AV Strength
This column communicates the relative quality of the analytical view, using a 5-star rating system. See Score Detail to understand how Arcadia Data rates analytical views.
- Next Scheduled Refresh
For columns that have scheduled refreshing, this column indicates the time period before the next refresh.
- Last Successful Refresh
This column indicates the relative time after the last refresh of the analytical view.
- Refresh Analytical View
The icon (refresh) is available only when the analytical view is not in the Up to date state. Clicking it refreshes the analytical view.
- Schedule Analytical View Refresh
Clicking the (calendar) icon opens the Schedule Refresh modal window where you can ensure that the analytical view refreshes periodically.
- Delete Analytical View
The (trash) icon is available at all times. Clicking it brings up the Delete confirmation modal window to confirm the removal of the analytical view.
- Detail
Clicking the Detail link opens the AV Details window modal, that shows all the information about the analytical view, including Score Detail, Base Table Info, AView Info, and Aview SQL.
See Understanding the Details of the Analytical View.
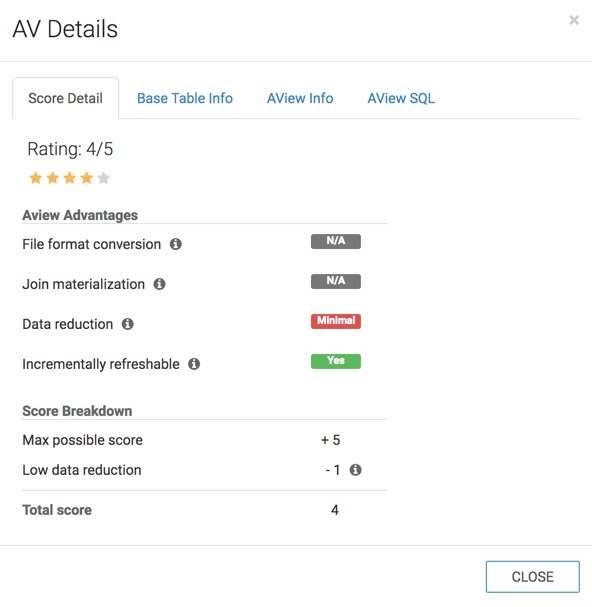
AV Details