Receiving Optional Measure Parameters in Dashboards
Arcadia Enterprise can hide or display measures at run-time. To do that, you must complete the following steps:
Creating Visuals with Optional Measures
You may choose to duplicate the dashboard that you created earlier according to the instructions in Receiving Optional Dimension Parameters in Dashboards. In this case, open the visual, and skip to Step 6 in the following workflow.
- Open a new dashboard.
- In the dashboard, click New Visual.
- Under the Data menu, select the World Life Expectancy dataset.
- Under the Visuals menu, choose the Table visual type.
Populate the shelves of the visual:
- From Dimension, select and move
un_regionandun_subregionfields onto the Dimension shelf. - From Measures, select and move
populationfield onto the Measures shelf. - From Dimensions, select and move
yearfield onto the Filters shelf. - On the Filters shelf, select
yearfield, choose Pick values from a list, select2000, and click Save.
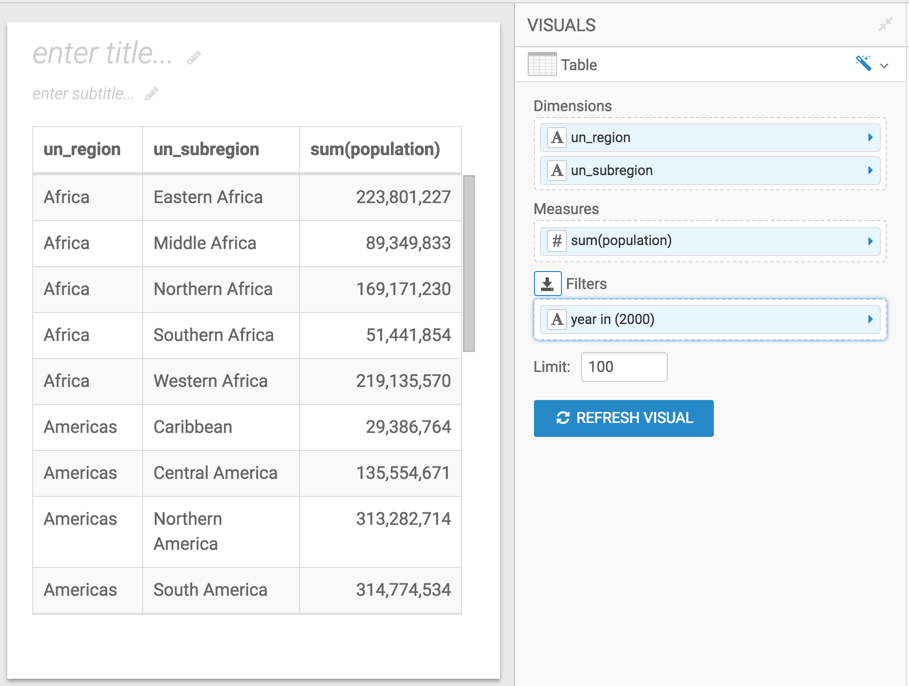
Set-up for Visual - From Dimension, select and move
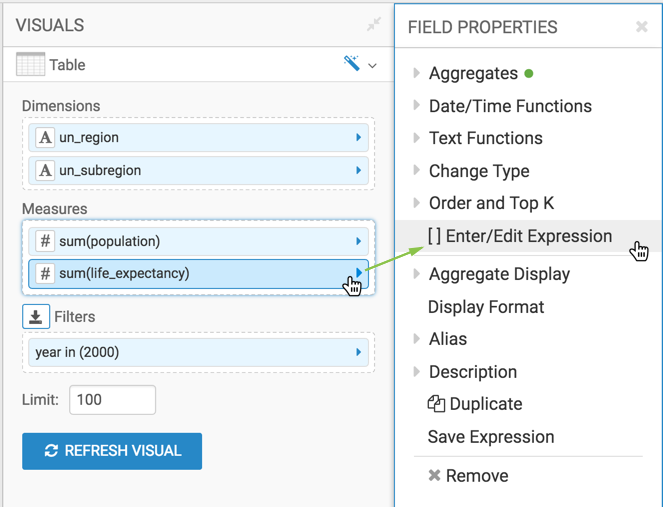
- From Measures, select and move the
life_expectancyfield onto the Measures shelf. On the Measures shelf, click the
life_expectancyfield.In the Field Properties menu, select [ ] Enter/Edit Expression.
In the Enter/Edit Expression modal window,
- Change the text to the following expression:
[<<mes:>>]. - Click Validate & Save.
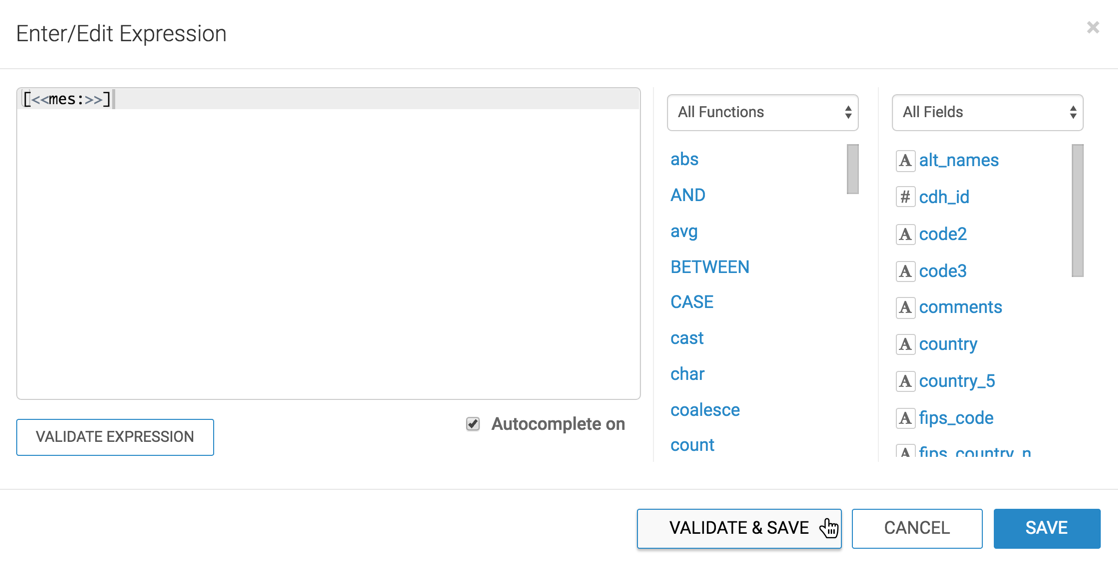
Creating an Optional Dimension in Enter/Edit Expression Interface - Change the text to the following expression:
- Click Refresh Visual.
- Change the name of the visual to Regional Populations.
- Click Save.
Creating Filters that Control Optional Measures
Before starting on this work flow, complete the steps in Creating Visuals with Optional Measures.
- In the dashboard, click the Filters tab.
-
Click Create Custom Filter to create a second dashboard filter.
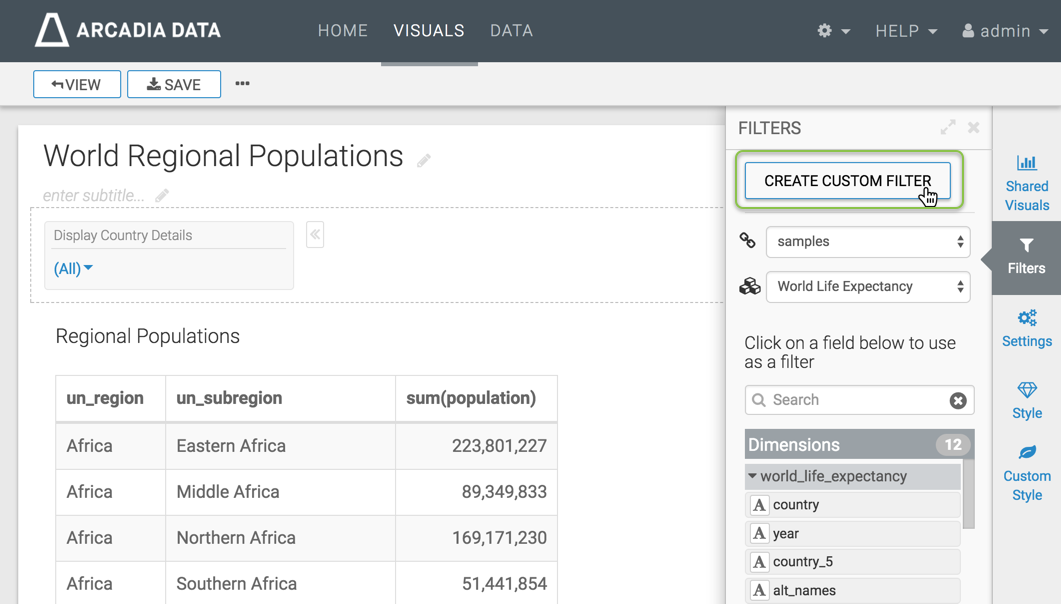
Adding a New Parameter Filter to the Dashboard -
This creates a New Filter in the filter area of the application, and opens the Settings window modal for that filter.
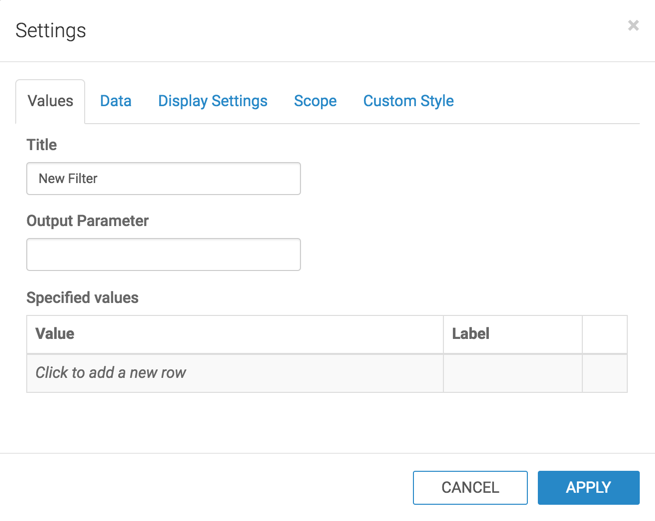
Initial Settings for a Custom Filter -
In the Settings modal window, under the Values tab, enter the following:
- Under Title, enter Display Measures.
-
Under Output Parameter, enter mes.
Note that this is the parameter from Creating Visuals with Optional Measures.
-
Under Specified values, enter the following two rows:
- Value:
life_expectancy, Label: Life Expectancy - Value:
gdp_per_capita, Label: GDP per Capita
- Value:
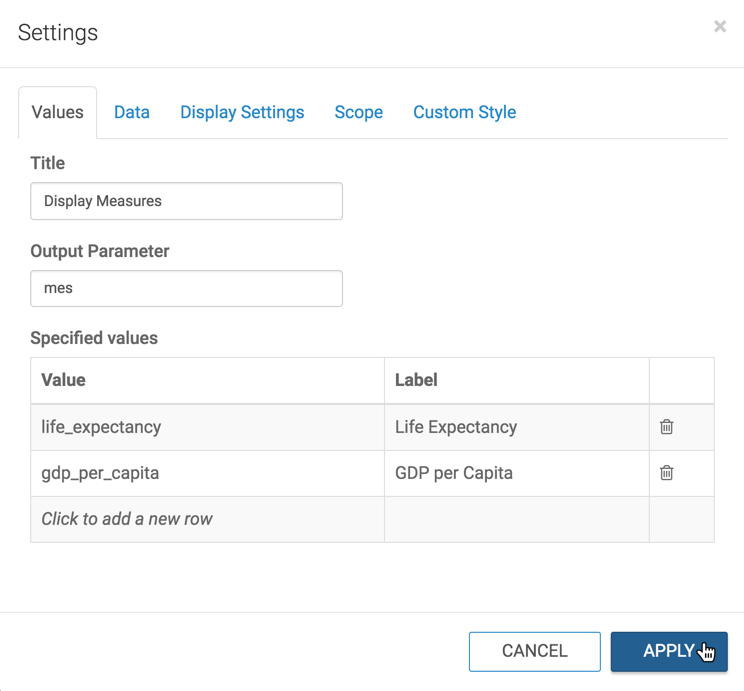
Configuring Values Settings for the Optional Dimension -
In the Settings modal window, switch to Display Settings tab, and select Allow only one item to be selected at a time and then select Include an option for 'All'. .
Click Apply.
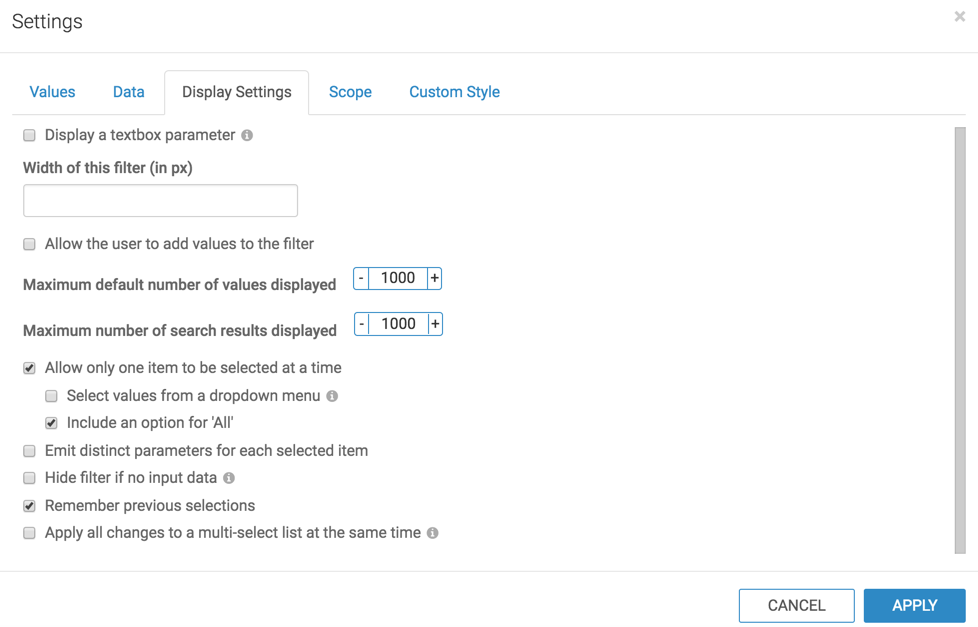
Configuring Display Settings for the Optional Measure - Name and save the dashboard.
-
Switch to application View mode, and select World Regional Populations.
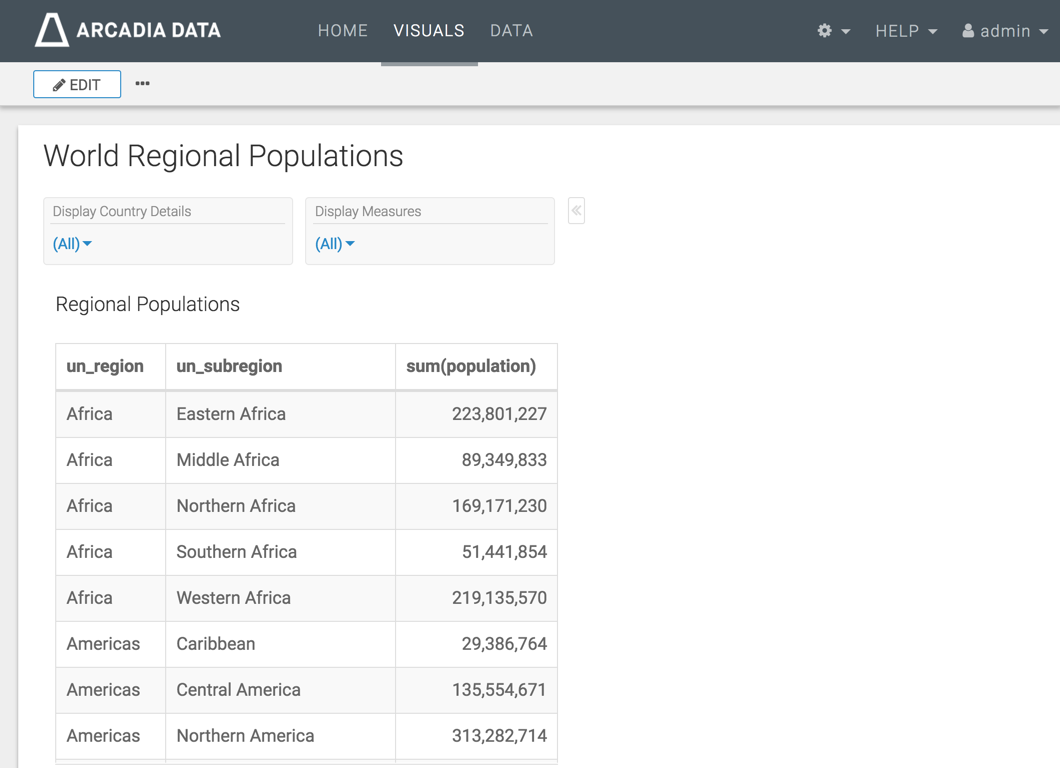
Dashboard with Optional Dimension and Measures, at Runtime - [Optional] In the Display Country Details filter, select Country.
-
In the Display Measures filter, select Life Expectancy.
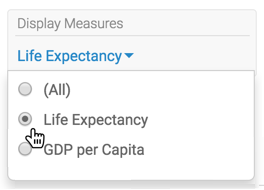
Choosing to Filter on 'Life Expectancy' Note that the table now has a new column, life_expectancy.
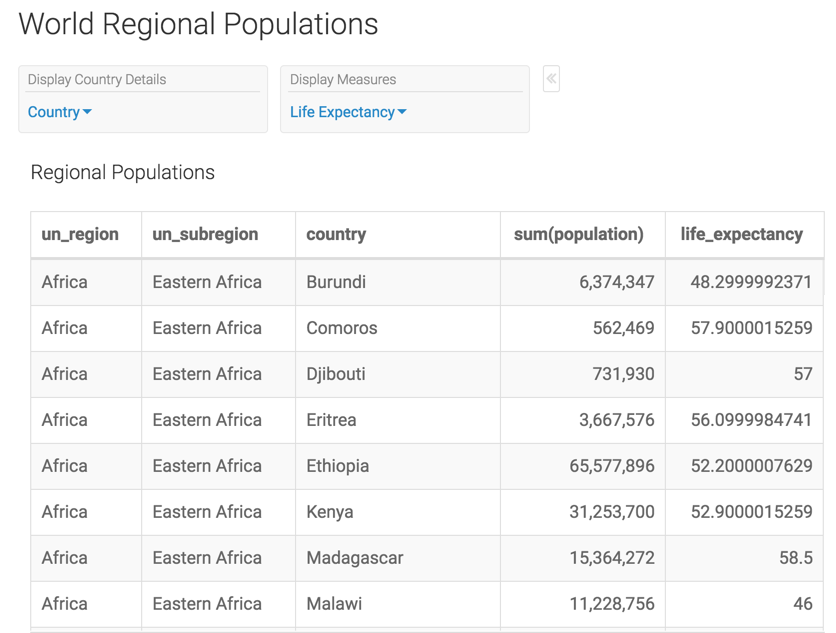
Optional Measure 'Life Expectancy' Included in the Dashboard -
You can change the measure that appears in the visual.
In the Display Measures filter, select GDP per Capita.
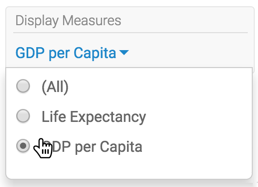
Choosing to Filter on 'GDP per Capita' Note that the additional column is now titled gdp_per_capita, not life_expectancy.
To check the parameters of the dashboard, hover the pointer over the (filter) icon at the top right corner. They are
dim: country,dim.alias: Country, andmes: gdp_per_capita. You can scroll down to see themes.alias: GDP per Capitaparameter.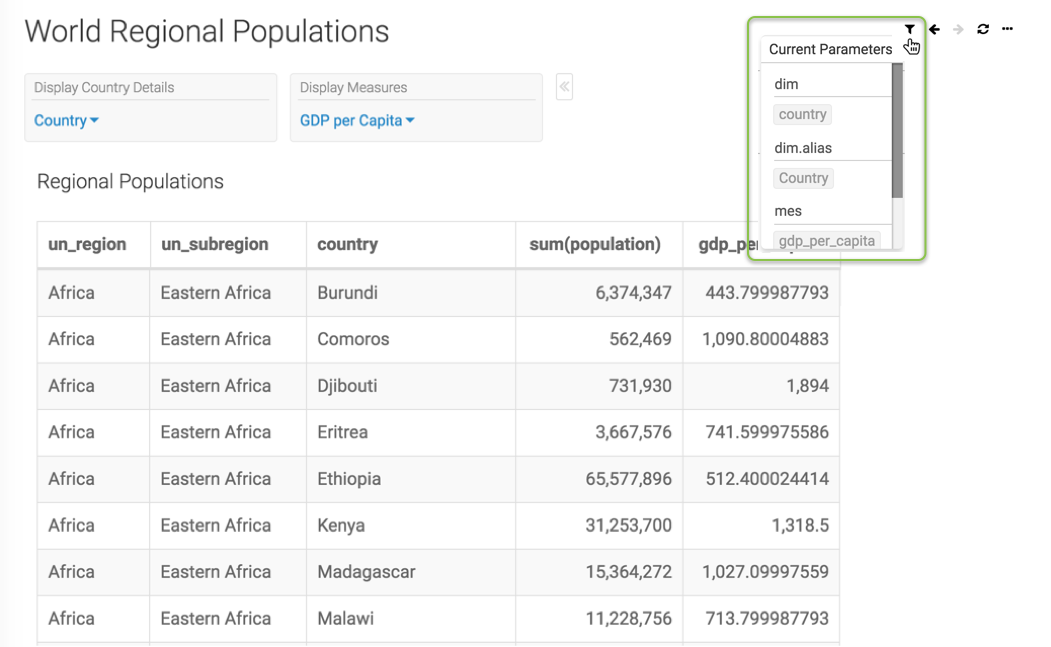
Optional Measure 'GDP per Capita' Included in the Dashboard - [Optional] You can easily navigate between the permutations of filter outputs you create by using filter navigation controls at the top right corner.