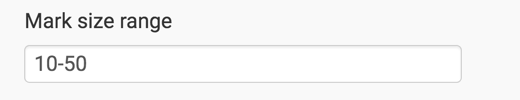
Changing the Mark Size Range
Use the Mark size range option to adjust the size of circles or bubbles on scatter and map visuals.
This setting applies to Map and Scatter visuals.
To adjust the relative size of marks on the visual, such as circles in scatters or bubbles in maps, navigate to the Marks menu, and adjust the minimum and maximum numbers for the Mark size range option.
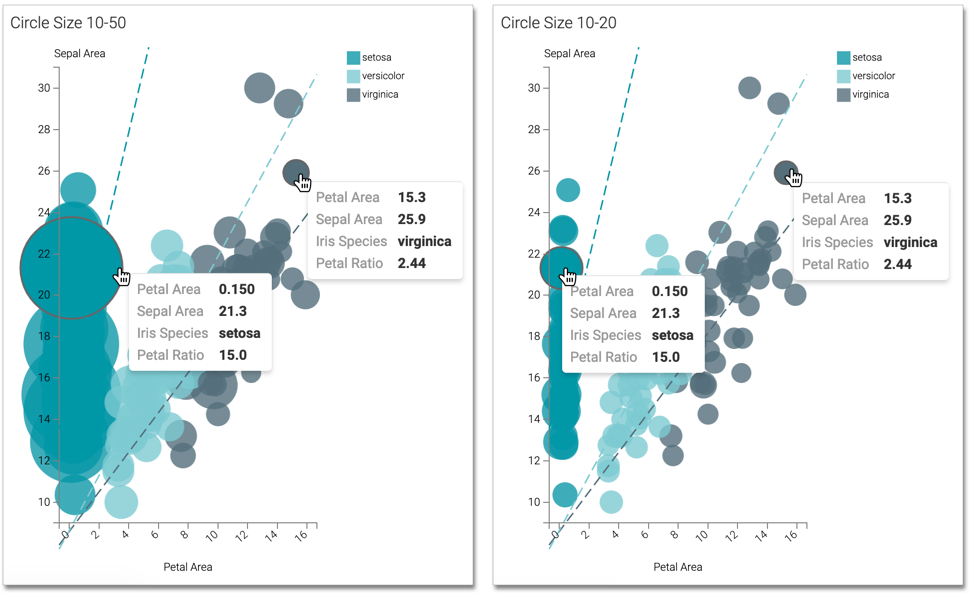
Mark Size Range in Scatter Visuals
Compare the appearance of a scatter plot that has marks at size 10-50 (the
default) to the one at size 10-20 bubbles.
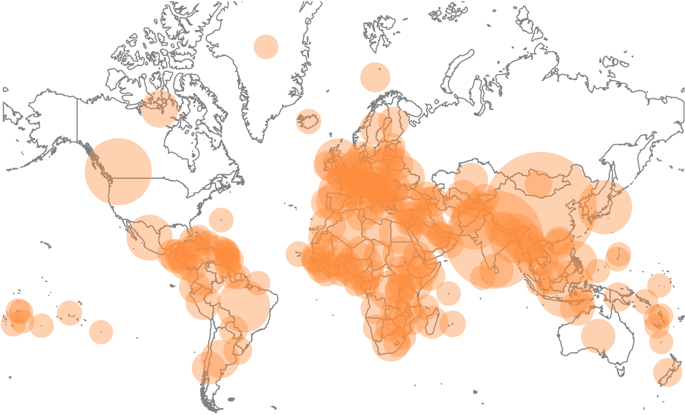
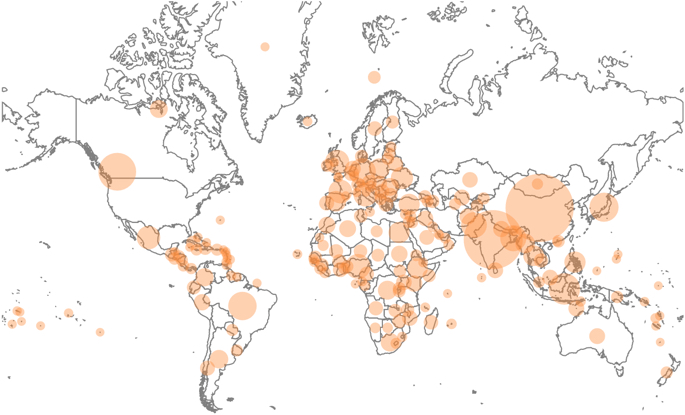
Mark Size Range in Map Visuals
Compare the appearance of world map visual with marks at size 10-50 (the
default) to the one at size 1-30 bubbles.