Using the Tooltips Shelf
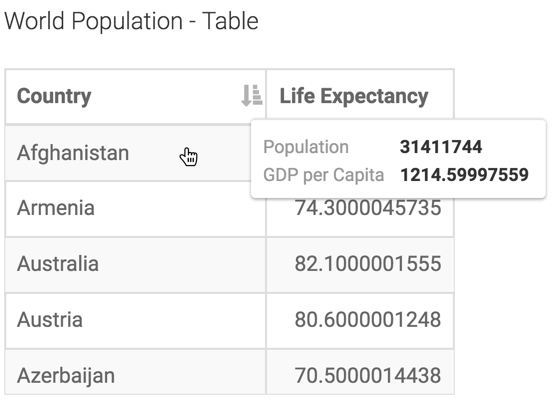
Sometimes, we want to show a limited number of columns in a visual, and yet have quick access to other relevant information. You can add multiple fields to the Tooltips shelf, and then view the additional data. In the following illustration, we added the fields Population and GDP per Capita to the Tooltips shelf.
Note that the measures placed into the Tooltips also appear in the data downloaded through the CSV option; see Downloading Visual Data to CSV Files.