Creating Choropleth Interactive Map Visuals
In an Interactive Map visual, Arcadia Enterprise enables you to create choropleth maps. A choropleth map shows geographical areas that are shaded in proportion to the value of the measurement that is displayed on the map.
- Use choropleth maps when your data is attached to enumeration units, such as counties, countries, zip codes, and so on.
- Standardize data to show rates and ratios instead of raw data counts. For example, instead of plotting gross GDP, plot GDP per Capita.
- Use choropleth maps when you have data with continuous statistical
surface. For example, Population is a count and representing it
in colored map may be misleading. Population density is a ratio
with a continuous statistical surface (even where
0represents unpopulated areas); so it can be used in choropleth maps.
To create a choropleth map, for each visual, you must specify the following:
- Custom mapbox style, which has a choropleth shape file in it. See Adding Custom Mapbox Style.
- Layer ID, which is the name of a unique layer within the Custom Mapbox style that identifies the shapes that you would like to color by a measure in your data. See Specifying a Choropleth Layer ID.
- Geo-type as Shape ID: The Arcadia dataset must have at least one field in the Geo shelf to determine the location on the map. You must change the Geo-type to Shape ID. A Shape ID is a key that joins the shapes in the Custom mapbox style and the field in the Arcadia dataset. This helps in identifying the measure that maps to the shape. This Geo field must be in the dataset that was used to create the custom mapbox style.
Let's create a choropleth map that colors the average tax liability in California by zip code.
In our example, the choropleth interactive map visual is based on the dataset
Personal Income Tax Statistics by Zip Code. For an overview
of shelves that specify this visual, see Shelves for Interactive Map Visuals.
- Create an Interactive Map visual; see Basic Interactive Map Visuals.
-
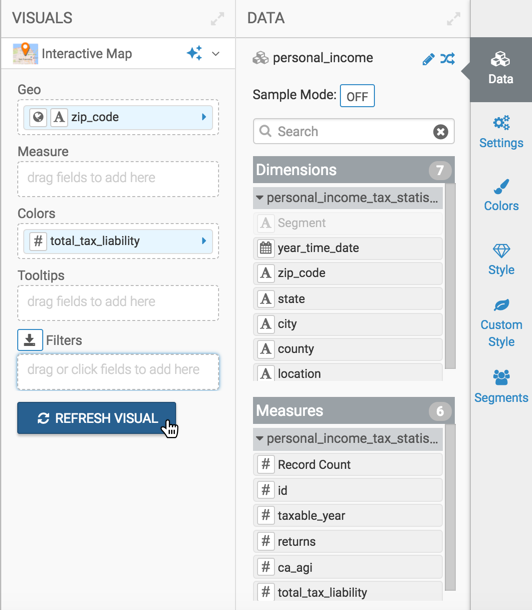
Populate the shelves from the available fields in Dimensions and Measures in the Data menu.
Note that to create a choropleth map, the dataset must have at least one field in the Geo shelf with Geo-type Shape ID.
-
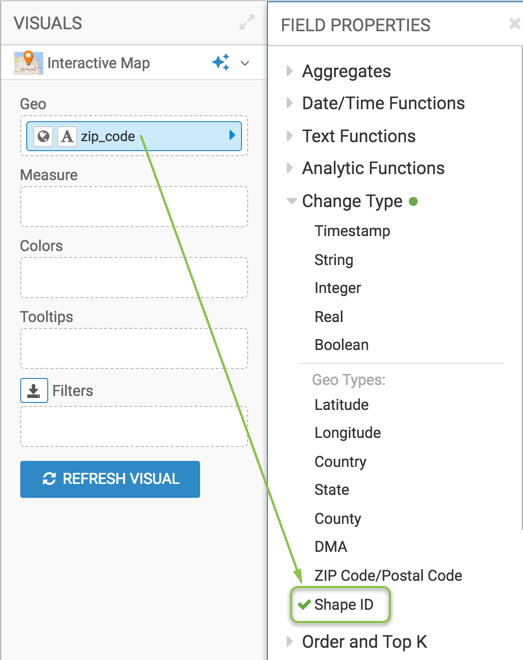
Select
zip_codefield and drag it over the Geo shelf to identify the shapes by zip code.Cast this to the appropriate Geo Type: click the field on the shelf, and in the Field Properties menu, select Change Type, and select Shape ID. This helps in identifying the measure that maps to the shape.
-
Under Measures, select the
avg(total_tax_liability)field, and drag it over the Colors shelf.Change the aggregation from
total_tax_liability, by selecting Aggregates AverageThis colors the average tax liability in California by zip code.
-
- Navigate to the Map Style menu under
Settings, and enter a Custom mapbox
style that you have obtained from Mapbox. Make sure that
this style has a choropleth shape file in it.
- Navigate to the Choropleth menu under
Settings, and enter a Layer
ID. Choropleth Layer ID identifies
the shapes that you would like to color by a measure in your data..
-
Click Refresh Visual.
-
The choropleth map visual appears.
If the visual does not display a choropleth map, check that the Geo-type of the
zip_code field is set to Shape ID.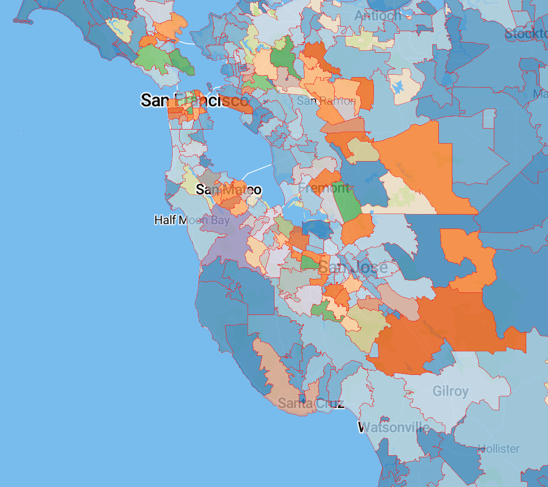
Proceed to Customizing the choropleth map.