Search Visuals
On Arcadia connections, a search visual enables you to place a data search button directly on the dashboard; this is particularly useful in embedded cases.
The purpose of the search visual is to include search functionality in embedded dashboards.
Creating a Search Visual
The following steps demonstrate how to specify search visuals.
- Start a new visual; see Creating Visuals.
-
In the visuals menu, find and click Search.
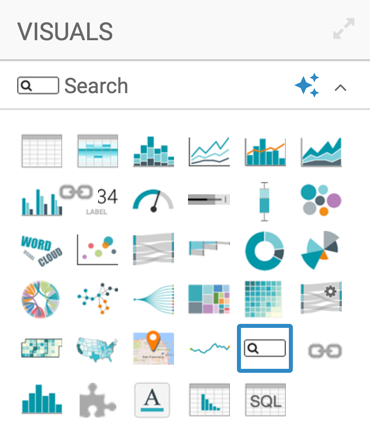
-
Note that this visual type does not use shelves.
-
In the main panel of the Dashboard Designer for visuals, note that you have two selection menus:

- Dataset Selector
This menu lets you restrict the search to the datasets in the following manner:
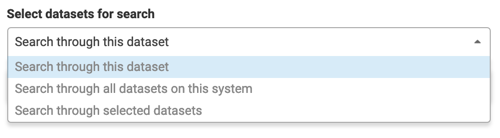
- Search through this dataset
This option limits the search to the current dataset.
Note that the dataset appears in the Data menu on the left of the Dashboard Designer; you can also switch the native dataset of the visual in this menu by clicking the (switch) icon.
- Search through all datasets on this system
This option enables search on all datasets on the system to which the user has access, provided search functionality is enabled.
- Search through selected datasets
This option lets you specify which of all the possible datasets should be searched. The system only shows the dataset where search functionality is enabled.
- Search through this dataset
- Search Box
This is the area where you enter the search phrase about your data.
- Dataset Selector
- Change the title to
Search. At the top left corner of the Visual Designer, click Save.

- Click Close on the menu across the top to return to the dashboard in Edit mode.
Using the Search Visual in a Dashboard
The steps in this section demonstrate how to use the search visual in a dashboard.
-
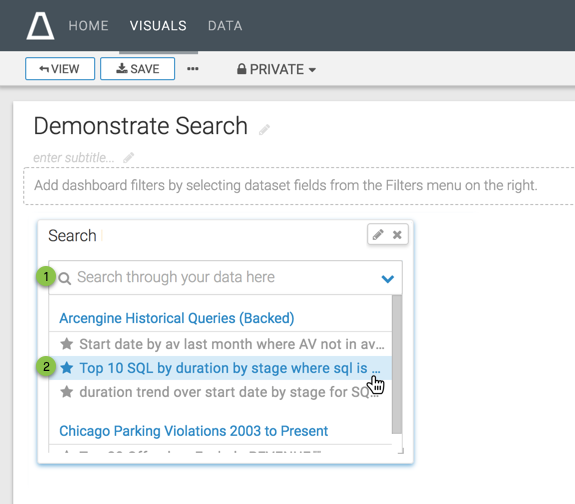
In the dashboard, note that the Search Box Visual appears. Its only element is the search box.
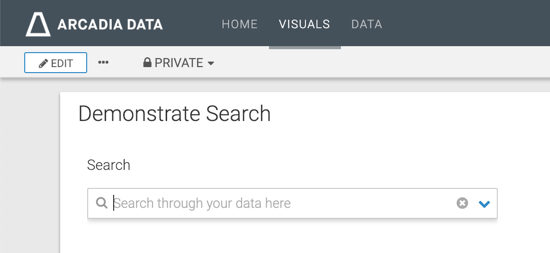
-
Click on the search box, and select one of the following search alternatives:
- Type in new search statement.
-
Select one of the searches in the drop down list. They are grouped into the following categories:
- Grouped by Dataset
Each dataset that the user can access includes previous and defined default searches. Note the icon used for this search, .
- Favorites
These searches have been previously declared as favorites. This is the icon, used for favorites: .
- Search History
This category of searches lets you choose the most recent searches. Note the use of the icon, .
- Grouped by Dataset
-
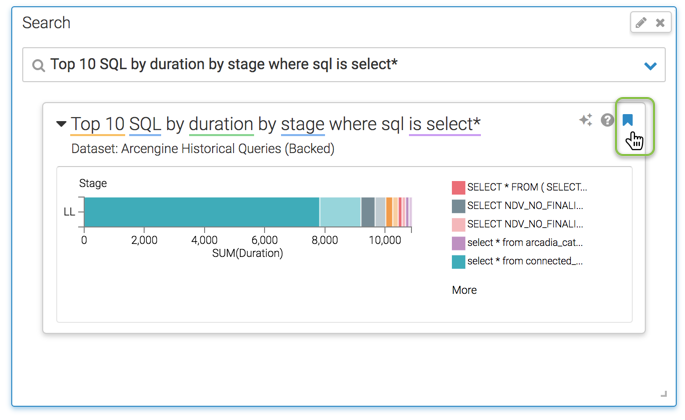
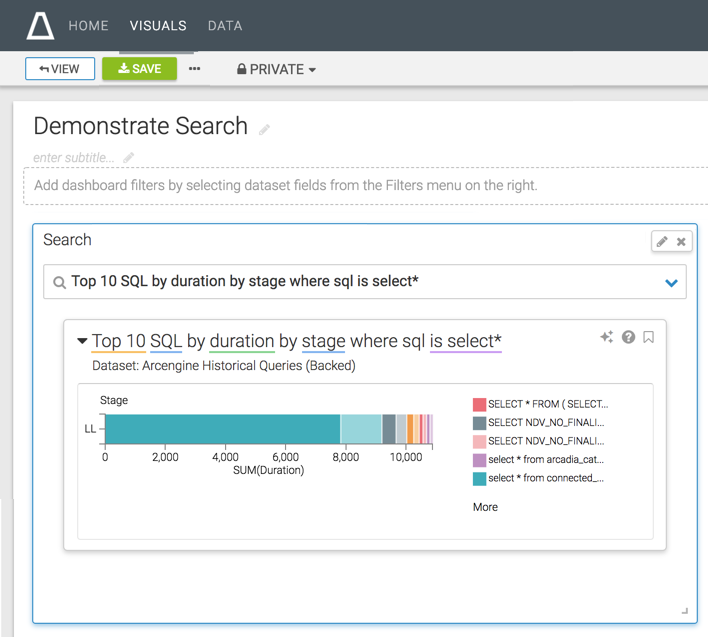
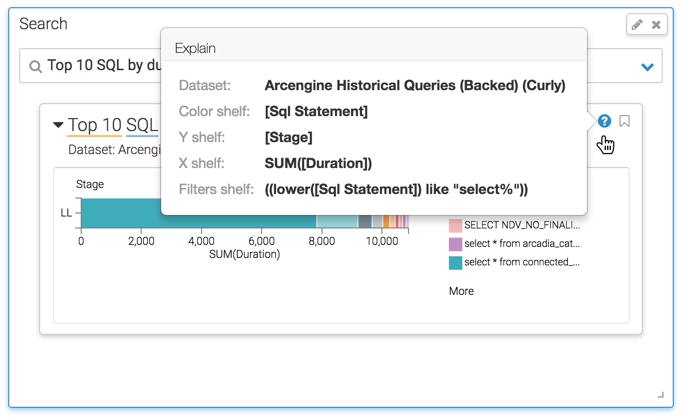
After selecting a search, the visual changes. It shows both the search box with specified search statement, and the visual that reports the results of that statement.
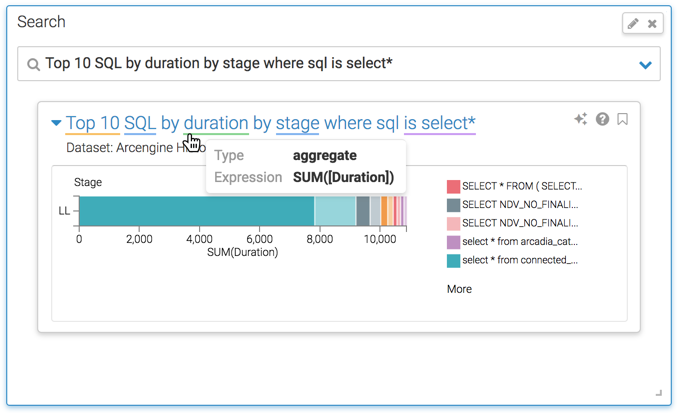
Notice that the various components of the search statement show colored highlights. If you move your mouse over these parts of the statement, the Tooltip displays the details of the component.
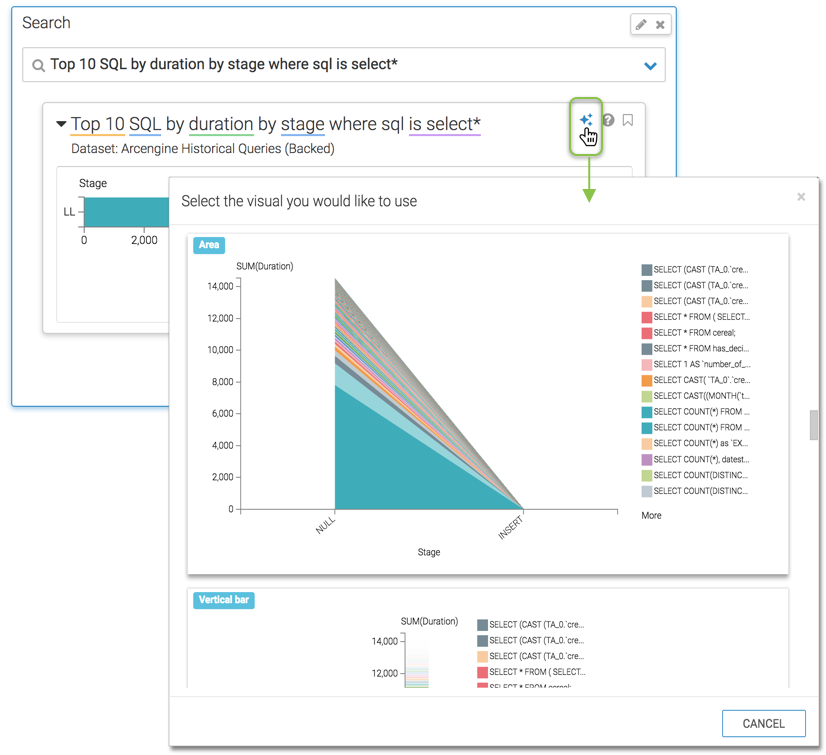
Clicking the (explore) icon enables you to browse among the suggested visual types, and select the one that best represents your data for the target audience.
This option is available when you enable Explore functionality; see Enabling Explore
Clicking the (help) icon shows the specifics of the visual: its dataset, and the fields that appear on the shelves of the visual.
Clicking the icon marks the search result as a favorite. This is a toggled setting.