Customizing Heatmap Layer
The heatmap layer is on by default, along with the Cluster layer.
The color of the heatmap indicates the value of the aggregate on the Measurements shelf, and it is determined by the color palette. The heatmap layer includes an optional color legend, which is in gradient form and is based on the color palette. The intensity magnification multiplies the value of the measure by a constant, and adjust the color display by pushing it 'higher' up the selected color palette. The heatmap radius displays, in pixels, the size of each point.
To get to the options in the Heatmap Layer menu, follow these steps:
On the right side of Visual Designer, click the Settings menu.
In the Settings menu, click Heatmap Layer.
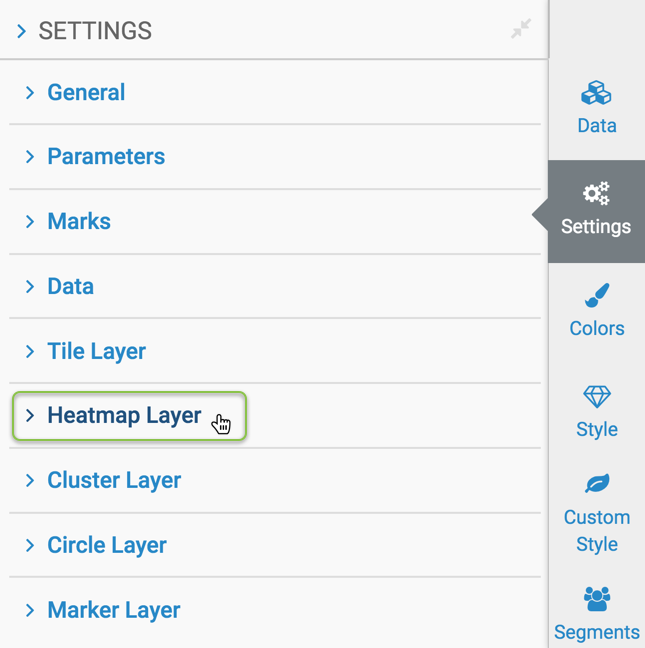
Make the appropriate changes under the Heatmap Layer options.
These options are:
Displaying the Heatmap Layer
To show or hide the Heatmap Layer, select or unselect Enable Heatmap Layer option. This option is on by default.

If you disable the Heatmap layer option, Google map renders only with the Cluster layer option, the other default.
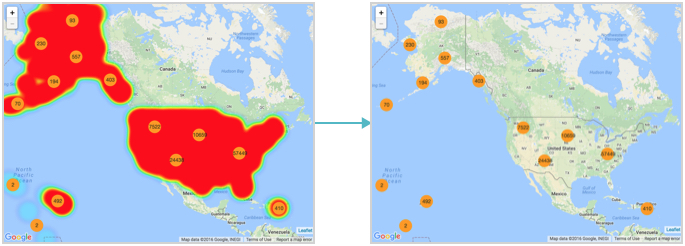
Similarly, the Mapbox map renders without the Heatmap layer option.
Showing the Heatmap Legend
To show the legend for the Heatmap layer, select or unselect Add Heatmap Legend option. This option is off by default.

After you enable the legend option, the legend appears in the lower right-corner of the Google map.
Similarly, the legend appears on the Mapbox map.
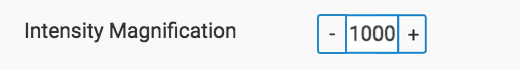
Changing the Intensity Magnification
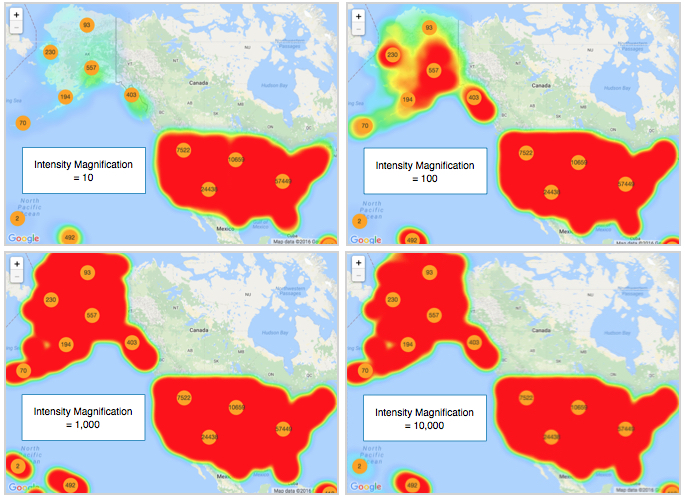
To change the intensity magnification of the Heatmap Layer, change the value for the Intensity Magnification option. The default value is 1000.
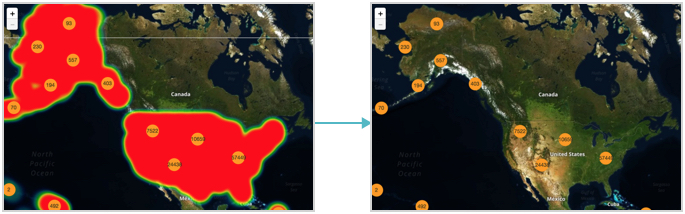
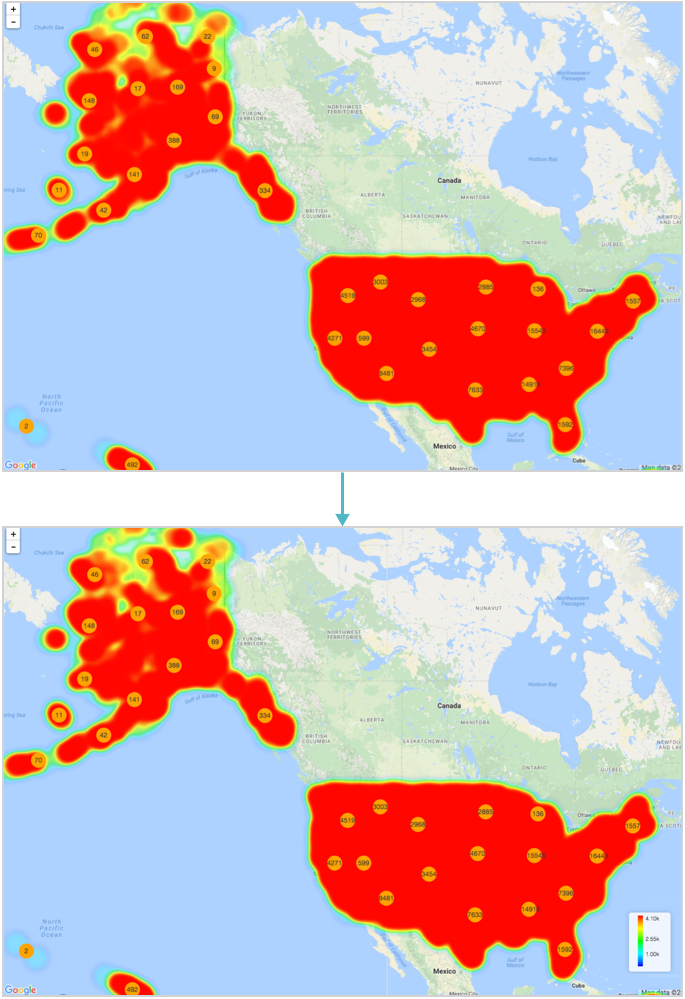
The default intensity magnification value is 1000. Compare the results of setting intensity magnification on Google Map to 10, 100, 1,000, and 10,000. In the following figures, the heatmap radius for all cases is 25.
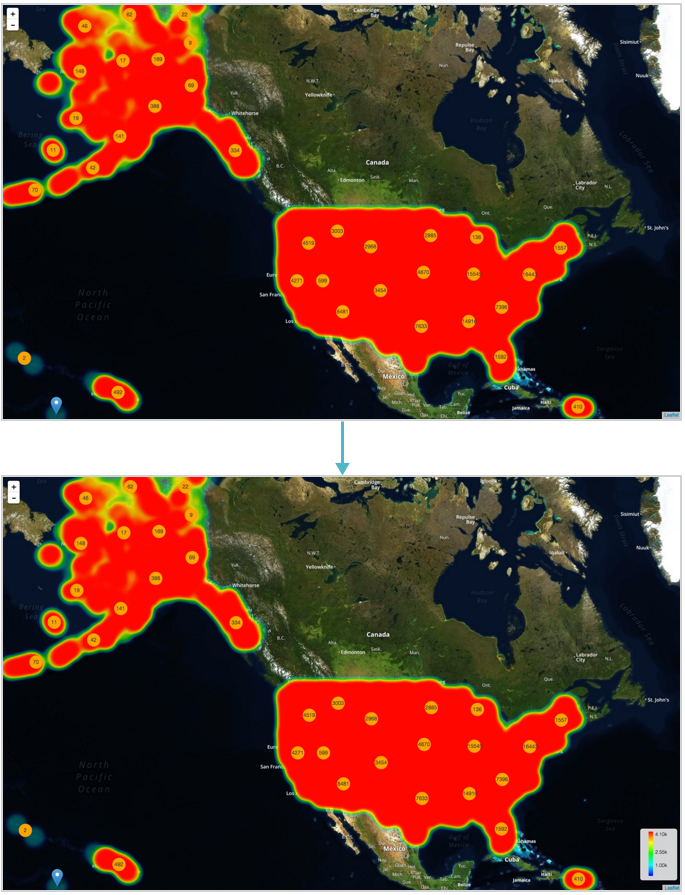
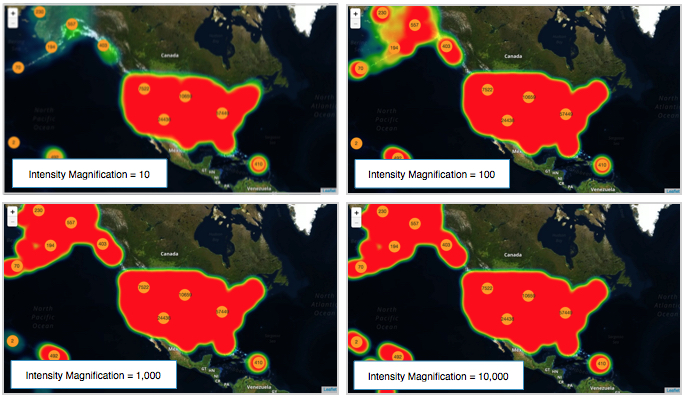
Similarly, compare the effect of the same heat intensity magnification settings on the Mapbox map.
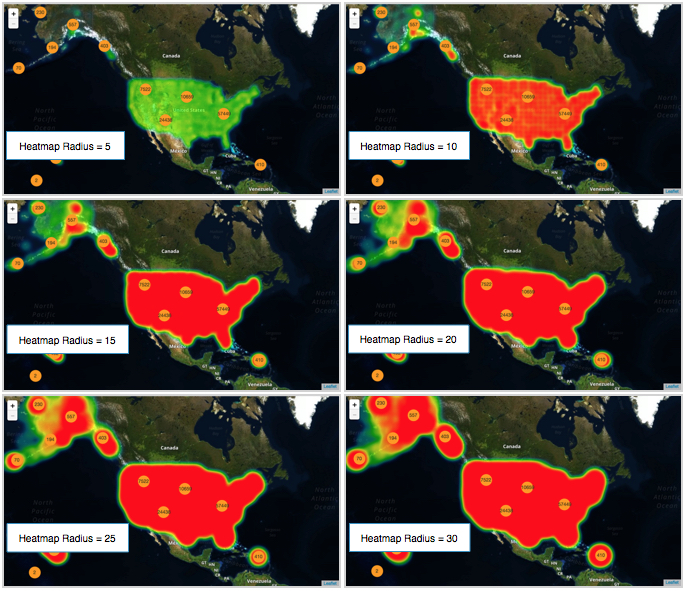
Changing the Heatmap Radius
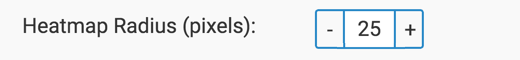
To show the granularity for the Heatmap Layer, change the value for the Heatmap Radius option. The default value is 25.
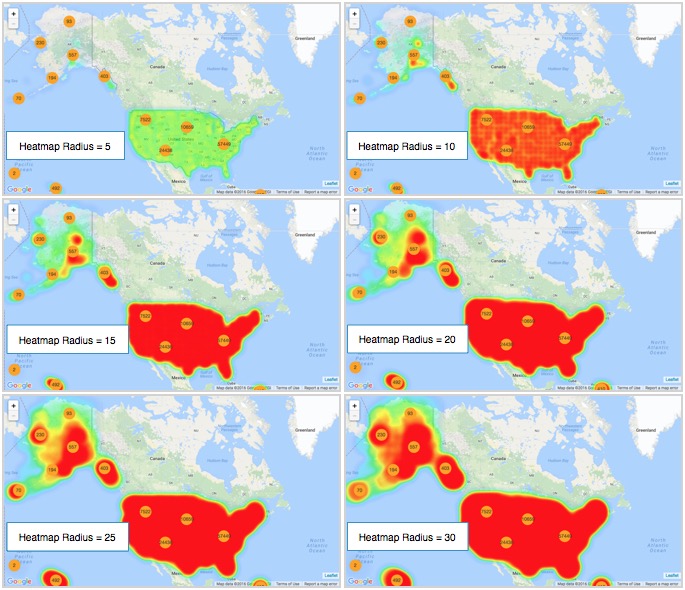
The default value of heatmap radius is 25. Compare the results of setting heatmap radius on Google Map to 5, 10, 15, 20, 25, and 30. In the following figure, the intensity magnification for all cases is 100.
Similarly, compare the effect of the same heat intensity magnification settings on the Mapbox map.