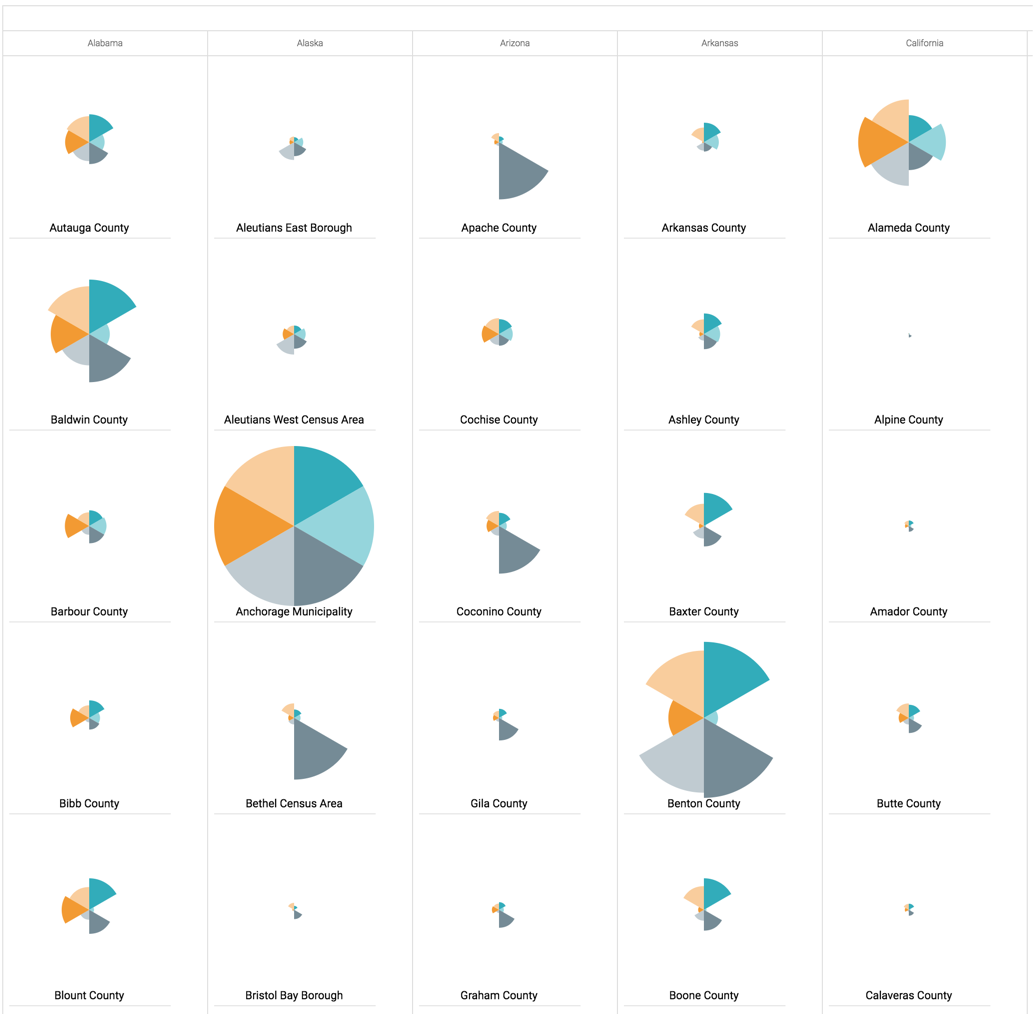
Trellised Radial
In this example in the US County Population dataset, we are using the field
stname (aliased as State) as a trellising
partition. Placed on the X shelf , it creates a trellised version
of a radial visual we developed in Radial Visuals.
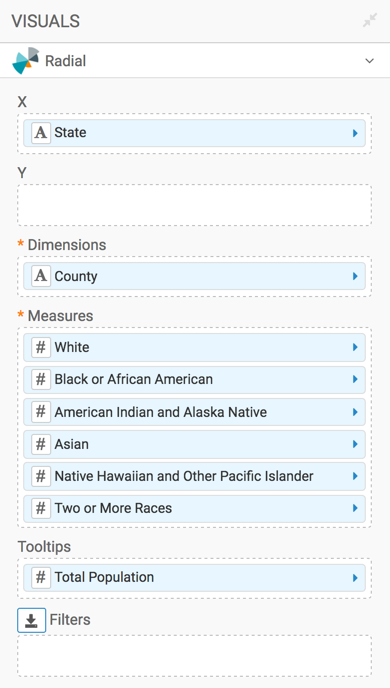
This is the shelves set-up for the trellised visual:
Notice that trellising organizes the individual radial charts into columns, by State. Within each column, the charts appear by alphabetical name of the County.