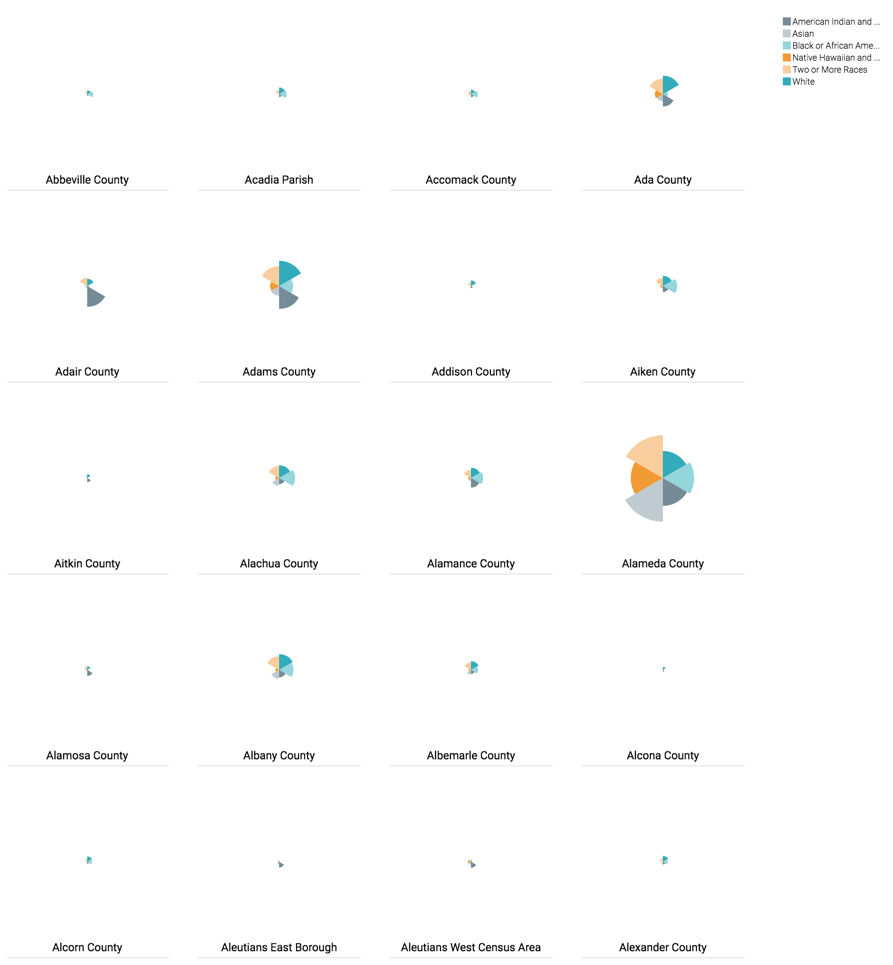
Radial Visuals
In Arcadia Enterprise, radial charts are a good approach for comparing the relative values of several measures. These measures are assigned an equal angle of rotation, and the relative values are represented through the areas of each wedge.
The following steps demonstrate how to create a new radial visual representation on dataset
US County Population [data source
samples.us_counties].
- Start a new visual based on dataset
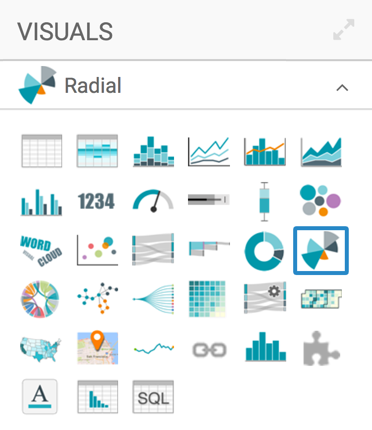
US County Population[data sourcesamples.us_counties]; see Creating Visuals. In the visuals menu, find and click Radial (row 3, column 6).
Note that the shelves of the visual changed.
They are now X, Y, Dimensions, Measures, Tooltips, and Filters.
Both Dimensions and Measures are mandatory.
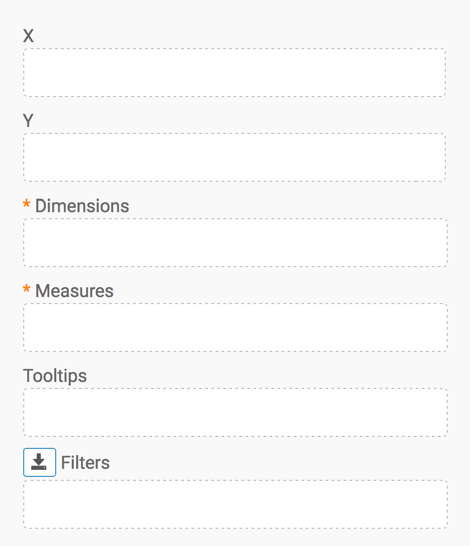
Populate the shelves from the available fields (Dimensions, Measures, and so on) in the Data menu.
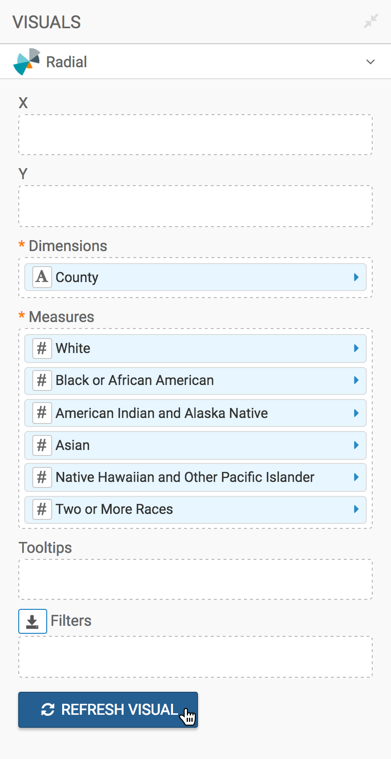
- Under Dimensions, select
ctyname, and add it to the Dimensions shelf. - Under Measures, select the following and add them all to the
Measures shelf:
wa_male,ba_male,ia_male,aa_male,na_maleandtom_male.
- Under Dimensions, select
Note that all fields on the Measures shelf show the sum of male populations. To show both male and female (total) in the group, change the calculations for the fields: change the expression
sum([wa_male]to(sum([wa_male])+sum([wa_female])), and so on.The following steps demonstrate how to use the Expression Editor:
-
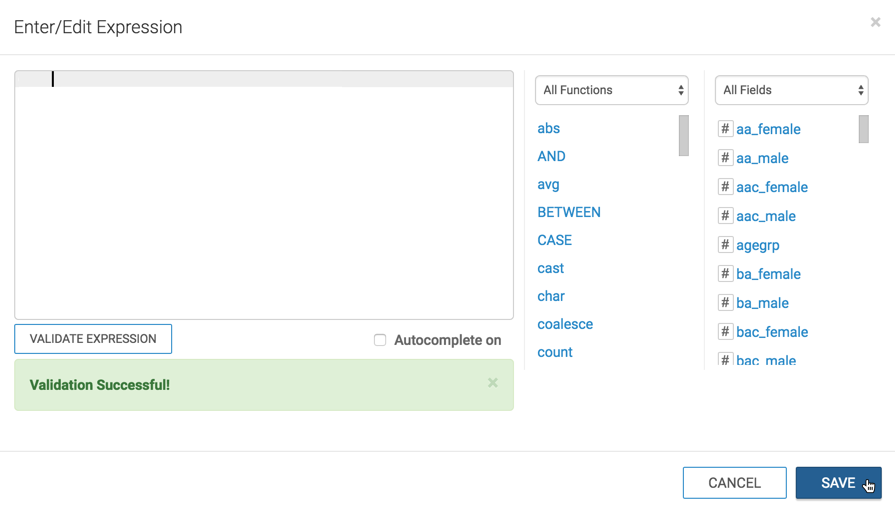
On the shelf of the visual, click the icon to the right of the field.
-
In the Column Properties menu, click the [ ] Enter/Edit Expression option.
-
In the Enter-Edit Expression window modal, edit the text manually or by pulling in the appropriate functions and fields.
Click Validate Expression to ensure that the computation works, and then click Save.
-
Click icon at the top of the Column Properties menu to close it.
-
Note that the column in the shelf now appears to hold the expression.
-
-
To improve the appearance of the visual, alias
ctynameasCountyon the Dimensions shelf, and all the fields on the Measures shelf:(sum([wa_male])+sum([wa_female]))asWhite(sum([ba_male])+sum([ba_female]))asBlack or African American(sum([ia_male])+sum([ia_female]))asAmerican Indian and Alaska Native(sum([aa_male])+sum([aa_female]))asAsian(sum([na_male])+sum([na_female]))asNative Hawaiian and Other Pacific Islander(sum([tom_male])+sum([tom_female]))asTwo or More Races
Note the steps for creating an alias:
-
On the shelf of the visual, click the icon to the right of the field.
-
In the Field Properties menu, click the icon next to Alias.
-
In the text box below Alias, enter the alias name of column, as it should appear in the visual.
-
Click icon at the top of the Field Properties menu to close it.
-
Note that the shelf now shows the column with its alias name.
-
Click Refresh Visual.
- Note all the information provided by the visual, for each county. Also, note how long the
visual is, as it lists every county in the nation.
- [Optional] Filter on
stnamefield to see a smaller visual, or trellis the visual onstnamefield, as described in Trellised Radial. - [Optional] Adjust the axes depending on what your visual demonstrates: comparison of measures within same dimension, relative values of measure compared to same measure across all dimensions, or relative values of measures compared to all measures across all dimensions. See Changing the Axes Scale for Radial Graphs.
- [Optional] You can replace the default 'wedge' representation of the radial chart with complete circles by enabling the overlap option on the Marks menu. See Change Display to Overlap.
-
Change the title to
Populations, by County - Radial.-
Click (pencil icon) next to the title of the visualization to edit it, and enter the new name.
[Optional] Click (pencil icon) below the title of the visualization to add a brief description of the visual.
-
At the top left corner of the Visual Designer, click Save.

At the top left corner of the Visual Designer, click Close.