Customizing Data
In the Data settings of Arcadia Enterprise, you can do any of the following:
- Changing Number of Rows to Download
- Change Maximum Number of Rows Fetched
- Disable Incremental Queries
- Display NULL Rows
- Order NULL Rows
- Enable URL Links
- Specifying Qualitative Range as Percentages
To get to the options in the Data menu, follow these steps:
On the right side of Visual Designer, click the Settings menu.
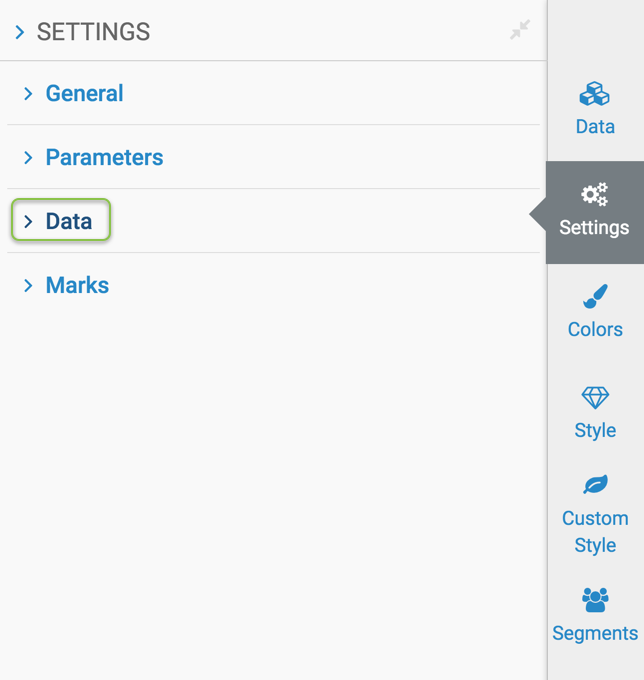
In the Settings menu, click Data.
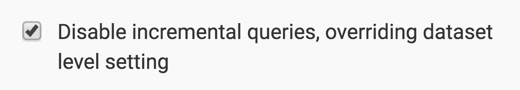
Disabling Incremental Queries
To disable incremental queries for this visual, navigate to the Data menu, and select Disable incremental queries.
Displaying NULL Rows
To change the data display of NULL values in the visual, navigate to the Data menu, and change the mask under the heading Display null value as.
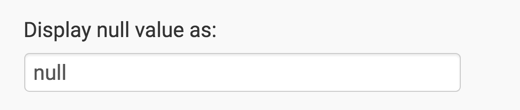
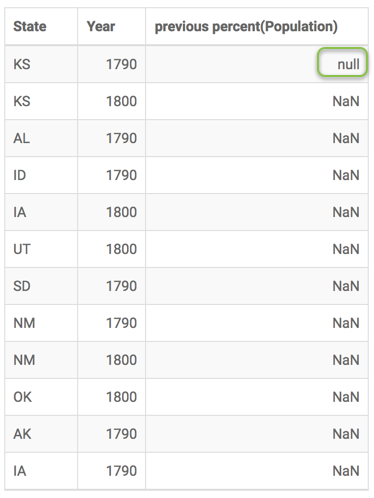
By default, this value is null. This is how the visual appears:
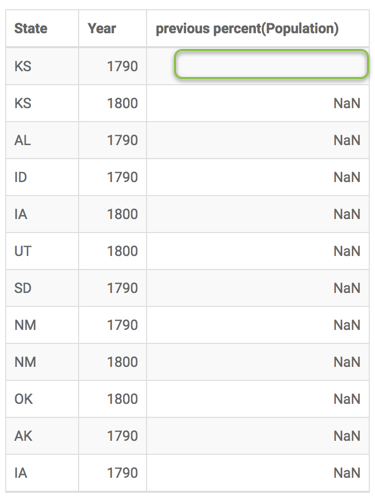
If the value is cleared (a blank), this is how the visual appears:
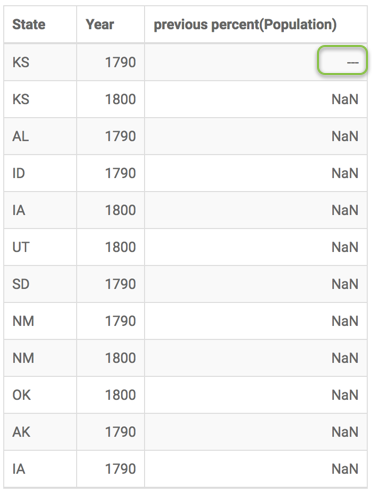
If the value is set to a few dashes (---), this is how the visual appears:
Ordering NULL Rows
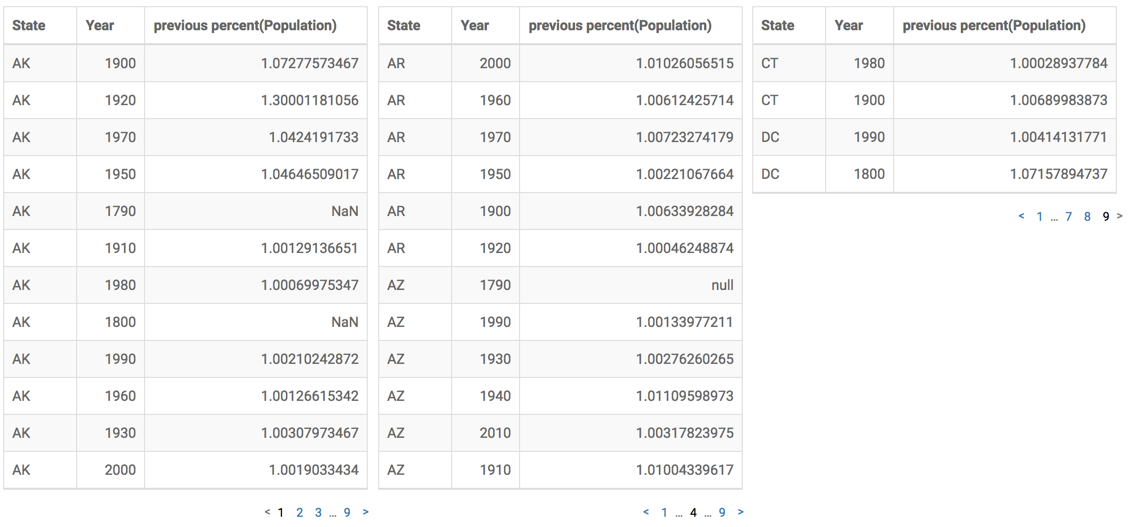
To change the order in which NULL values appear in the visual, navigate to the Data menu, and select one of styles under the heading Show data with NULL values: Default, First, or Last.
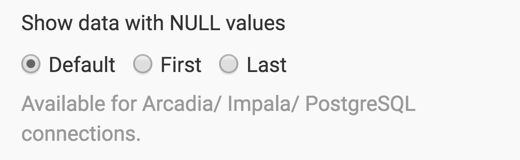
Default NULL ordering shows NULL data 'as is', without sorting the results.
-
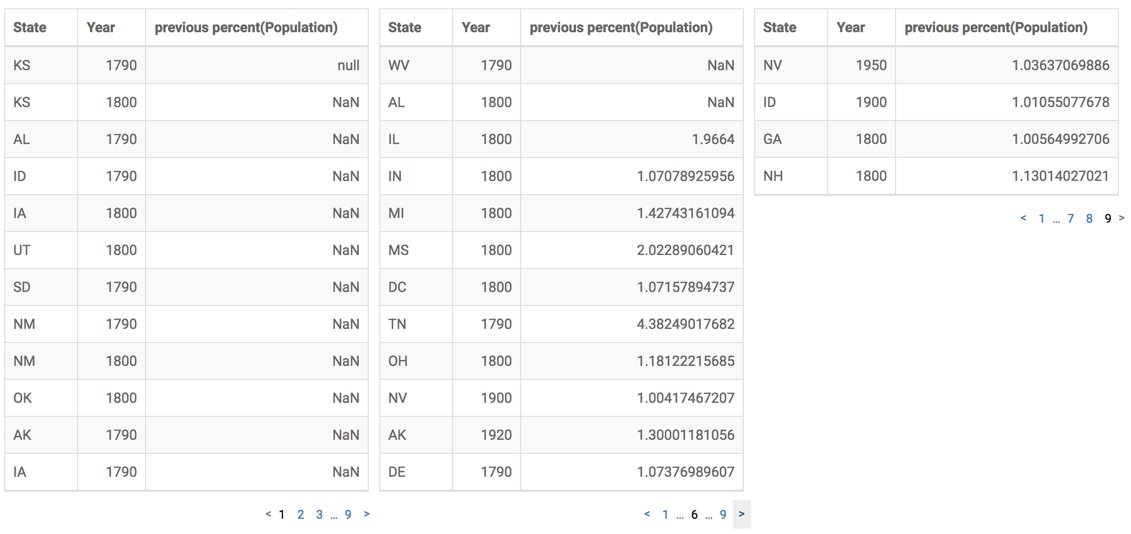
First NULL ordering shows NULL data first, after the sort of the specified column.
-
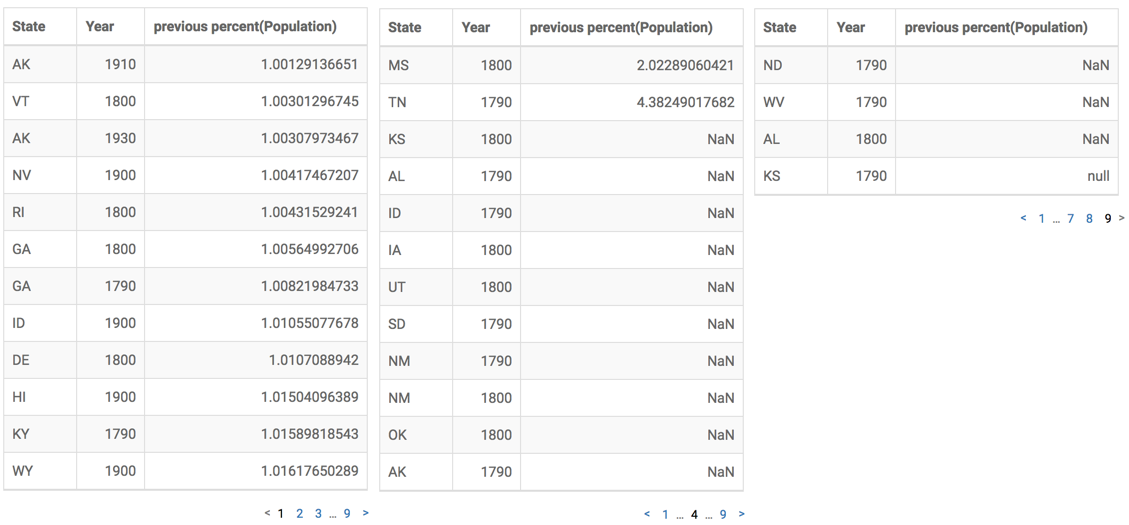
Last NULL ordering shows NULL data last, after the sort of the specified column.
Changing Maximum Number of Rows Fetched
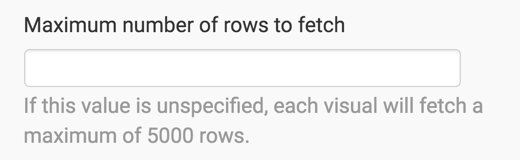
To change the number of maximum rows fetched, navigate to the Data menu, and change the value under the heading Maximum number of rows to fetch.
By default, the system fetches 5,000 rows at a time.
Note that for table visuals only, the value on the Limit shelf overrides this setting.
Changing Number of Rows to Download
To change the number of maximum rows downloaded during CSV export, navigate to the Data menu, and change the value for the option Number of rows downloaded during CSV export and Detailed Data.
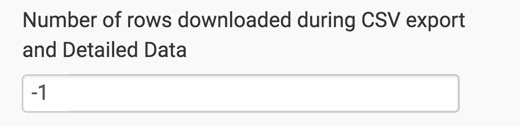
This setting overrides the Maximum number of rows to fetch option in the Data menu. For table visuals only, it also overrides the value on the Limit shelf.
If the Number of rows downloaded during CSV export and Detailed Data option is not specified, the setting of the Maximum number of rows to fetch option specifies the number of rows to download. For table visuals only, the value of the Limit shelf is used first, but if no value is specified in this option, then the Maximum number of rows to fetch value applies. See Changing Maximum Number of Rows Fetched.
Limiting Rows Downloaded to CSV File
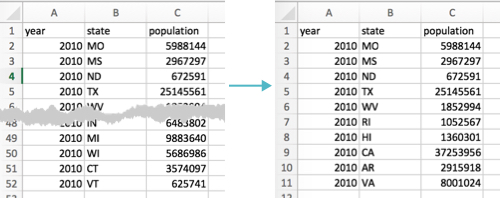
Set the value of this option to 10.
After downloading this visual's data as CSV (see Downloading Visual Data to CSV Files), check the number of rows.
Note that compared to the default download with value of -1 (left side), only
10 rows are present in the exported data, to match the number of rows specified
earlier.
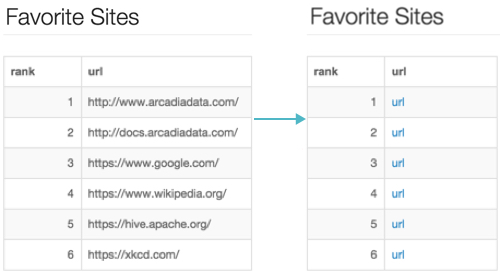
Enabling URL Links
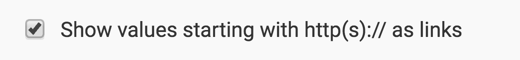
To render values that contain usable http addresses as navigation links, navigate to the Data menu, and select Show values starting with http(s):// as links.
Compare the appearance of the table visual with http... content before
and after the preceding selection.
Specifying Qualitative Range as Percentages
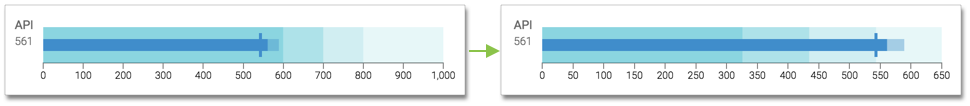
The Gauge and Bullet visuals use the Qualitative Ranges shelf to define the fit of the main value (on the Measure shelf) relative the value specified by the Compare To shelf. An alternate approach is to specify these ranges as percentages.
To use the percentage option, navigate to the Data menu, and select Use percentages of "Compare To" value if no qualitative data provided. Then specify the percentage value for the Lowest, Middle, and Highest ranges. By default, these are 60%, 80%, and 100%, respectively. Note that the scale accommodates up to 200%, to track outperforming categories.
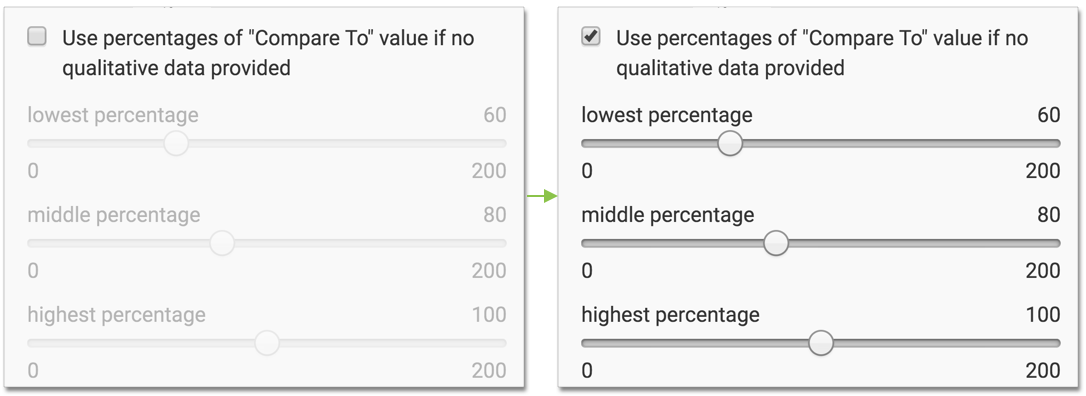
The visual on the left shows the ranges when they are explicitly defined as scalar values 600, 700, and 800. The visual on the right shows the qualitative ranges as percentages: 60%, 80%, and 100%.