Percent of Group Analytic Function
This article describes how to use the Percent of Group analytic function in Arcadia Enterprise.
We are using the Basic Visual for Aggregates to demonstrate how to use the Percent of Group analytic function.
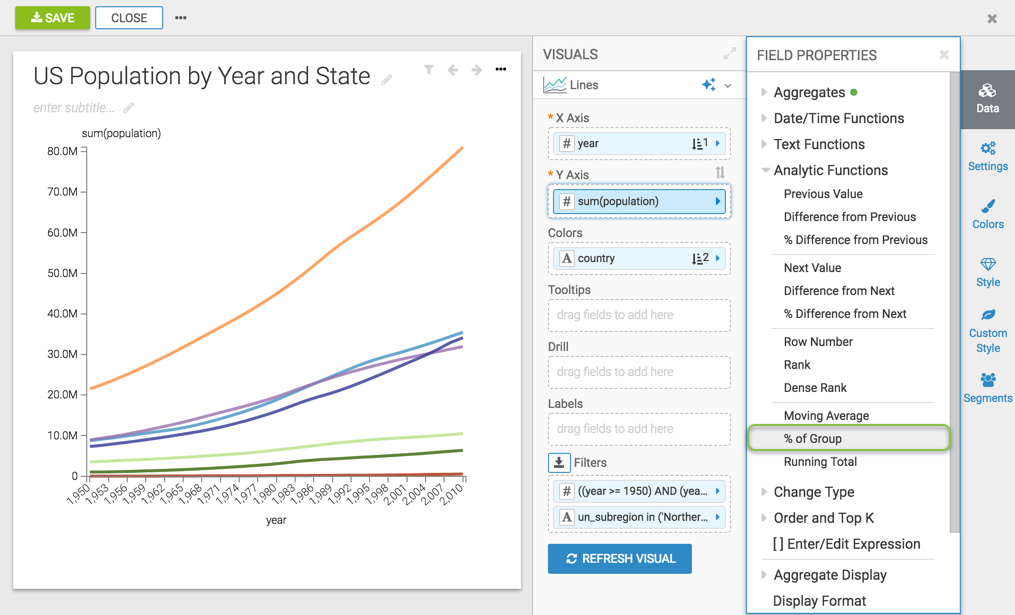
- Click the field on the measurement shelf, in this case, the
sum(population)field on the Y Axis shelf. - In the Field Properties menu, expand Analytic
Functions, and select % of Group.
-
In the Analytic Function: Percent of Group modal window,
- In Select aggregate for this measure, leave the default Sum. The other aggregation options are Count, Minimum, Maximum, and Average. In addition, some connection types also support Approximate Distinct Count and Exact Distinct Count.
- Under Select entities over which to calculate percentage, select year. This is the grouping that applies when calculating the percent of group.
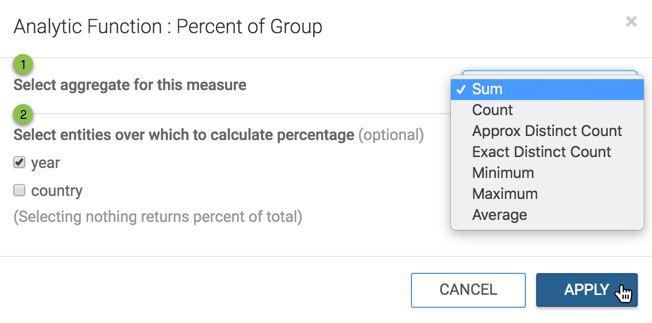
Analytic Function: Percent of Group - Click Apply.
-
[Optional] If you examine the expression in the Enter/Edit Expression interface, it shows that the function has the following form:
(sum([population]) / sum(sum([population])) over (partition by [year])) as 'percent(population)' -
Click Refresh Visual.
-
Notice the change in the Y axis and tooltips, from displaying the
sum(population)in millions topopulationas a percent.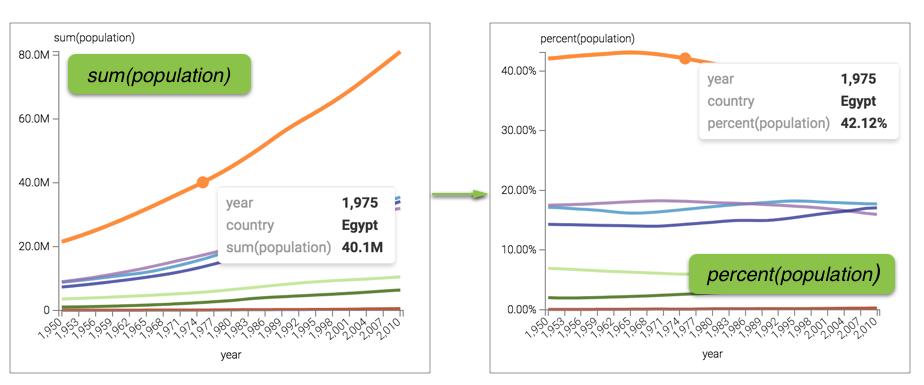
'Percent of Group' Analytic Function Visual