Creating Dashboards with Multi-Page Table Visuals
This document contains instructions on how to build an embedded dashboard that prints the full contents of a table as part of a dashboard print. This dashboard contains visuals at the top, and a table at the bottom. The table prints as many pages as necessary to display all rows. Table headers repeat at the top of each page.
We use several custom styles will be used to achieve the desired outcome. Complete these tasks to develop a dashboard with a large table that prints over multiple pages.
Create the Custom Table Style
These steps show how to create and add a dashboard style for printing long tables over multiple pages. This table must be the last visual in the dashboard.
Create a new style, Named Print PDF table - CSS/JS, as covered in CSS Custom Styles. The optional Description for this style can be as follows:
Add this Style to the table to be printed on multiple pages.
The table must be the last visual in the dashboard.
In the CSS tab, add the following code. Note that you can download it as multi-page-table.css.
@charset "UTF-8";
/* CSS Document */


/* screen table style */
.print-pdf-table table.table-bordered.dataTable {
  border-collapse: collapse !important;
}

.print-pdf-table .dataTables_scrollBody table tbody tr td {
  height: 0.53cm !important;  /* table row height */
  box-sizing: border-box;
  font-size: 10px;
}

@media print {
  @page {
    size: letter landscape;
    margin: 1.27cm 1.27cm 1.27cm 1.27cm;
  }

  .print-pdf-table .dataTables_scrollBody table thead tr th {
    border-bottom: solid #000 2px !important;  /* bottom border of table header */
    font-size: 12px;
    font-weight: bold;
    height: 1.48cm !important;  /* table header height */
    line-height: 1;
    padding: 12px 8px !important;
  }

  .print-pdf-table .dataTables_scrollBody table thead tr th > div {
    height: 1.48cm !important;  /* table header height */
    display: flex;
    justify-content: center;
    flex-direction: column;
  }

  .print-pdf-table table.dataTable.table-viz thead > tr > th.sorting {
    padding: inherit;
    padding-right: 8px; /* remove extra space where sort icon is displayed */
  }

  .print-pdf-table .dataTables_scrollBody table tbody tr td {
    height: 0.53cm !important;  /* table row height */
    box-sizing: border-box;
    font-size: 10px;
  }

  .gs-w.print-pdf-table .dataTables_scrollBody {
    max-height: none !important;
  }

/* this class prints the table on the second page */
/* remove to print normally */
  .gs-w.print-pdf-table {
     position: absolute;
     top: 23.5cm; /* add landscape page height + top margin */
  }

  .gs-w.print-pdf-table {
    height: unset !important;
  }

  .print-pdf-table .dash-viz-wrapper {
    display: contents;
  }
  .print-pdf-table .arc-viz-container {
    overflow: unset !important;
  }

  .main-app.arc-app-container.view-mode {
    display: table;
    background-color: transparent;
  }

  .control-container {
    background-color: transparent;
  }

  .arc-dashboard-title-container {
    padding-top: 1cm;  /* adjust if want more or less space at the top of the first page  */
  }

  .builder-container.view-mode,
  .builder-container-app,
  .builder-container {
    display: table;
  }

  .main-app-view,
  .main-view {
    overflow: visible !important;
    top: 0;
  }

  .main-view.view-mode {
    top: 0;
  }

  .print-pdf-table table th,
  .print-pdf-table table td {
    border: 1px solid #bbb !important;  /* border color */
  }

  .print-pdf-table table.table-bordered.dataTable {
    border-collapse: collapse !important;
  }

  .print-pdf-table  .arc-viz-title-container {
    display: none;  /* hide table title to print properly */
  }
  .print-pdf-table .dash-viz-wrapper {
    padding: 0;
  }

  .print-pdf-table .dataTables_scrollHead {
    height: 0;
  }

  .print-pdf-table .table {
    border-width: 0;
  }

  .print-pdf-table thead {
    break-inside: avoid;
    display: table-header-group;
  }

  .print-pdf-table table {
    page-break-after: always;
  }

  .print-pdf-table tfoot {
    break-inside: avoid;
    display: table-header-group;
  }

/* hide elements when printing  */
  #extension-print-btn,  /* extension buttons */
  #toggle-filter-container /* filter collapse icon */
  {
    display: none;
  }

}
In the JS tab, add the following code. Note that you can download it as multi-page-table.js.
return function() { var f = function() {}; f.version = "1"; f.afterDraw = function() { var $sel = $('#' + arcapi.chartId()); $sel.closest('.gs-w').addClass('print-pdf-table'); }; return f; }();- Save the new style.
Create the Dashboard
Create a dashboard on your target dataset. See Creating Dashboards.
Add several visuals to the dashboard, such as KPIs, summary tables, pie charts, and so on.
Add all necessary filters to the dashboard.
Specify Dashboard General Settings
Specify the settings necessary to achieve correct layout in dashboard:
- On the right side of Visual Designer, click the Settings menu.
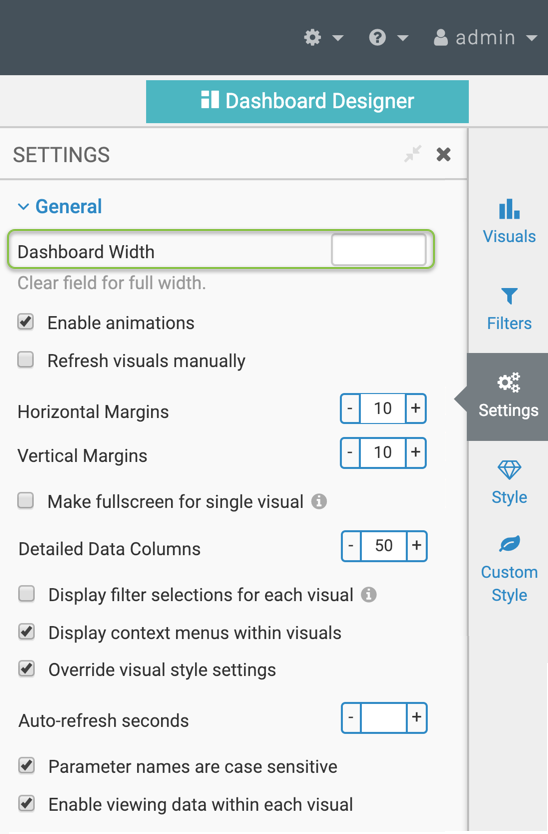
- In the Settings menu, click on General to open that menu.
-
In the General menu, clear the Dashboard Width specification; see Dashboard Width
Specify Dashboard Downloads Settings
Specify the settings necessary to print the dashboard using the PDF options:
- On the right side of Visual Designer, click the Settings menu.
- In the Settings menu, click on Downloads to open that menu.
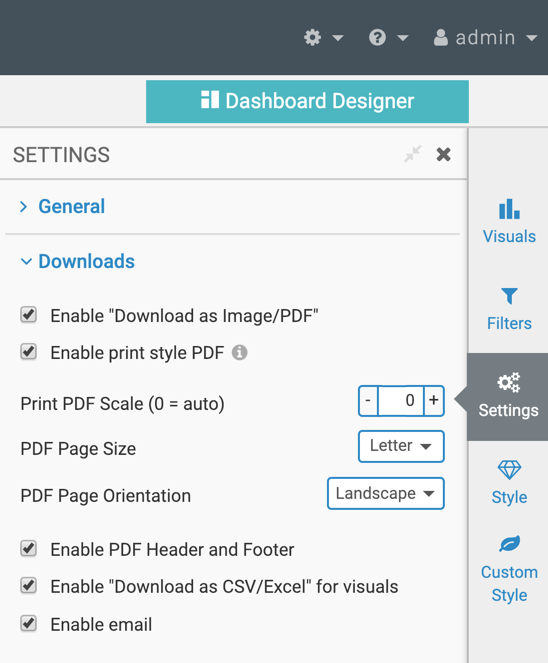
In the Downloads menu, make the following selections and changes:
- Enable "Download as Image/PDF"
- Enable print style PDF
- Print PDF Scale set to 0
- PDF Page Size set to Letter
- PDF Page Orientation set to Landscape
- Enable PDF Header and Footer
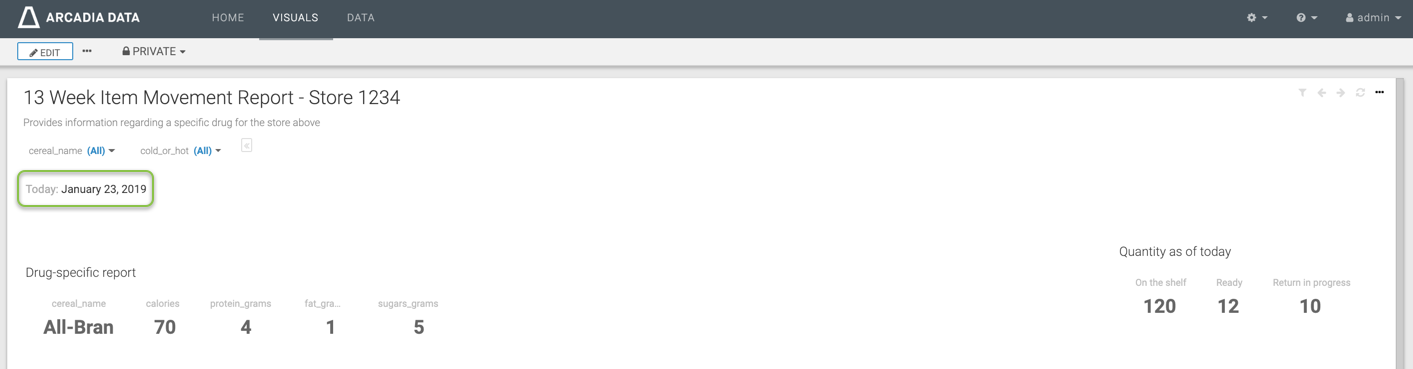
Add Time Stamp
Create the extension visual using the following definition:<span style="color:#aaa">Today:</span>
<span id="tdate"></span>
<script>
$(document).ready(function() {
var today = new Date();
$('#tdate').html(
$.datepicker.formatDate('MM dd, yy', today));
});
</script>When you add this extension visual to the dashboard, it would look similar to this (in View mode).
Add Capabilities to Print Dashboard and Download PDF
Using the following definition in an extension visual creates two buttons:
- Print button with an icon, Print
- Download PDF button with an icon, Download PDF
<div id="extension-print-btn">
<button class="btn btn-xs btn-primary"
onclick="window.print();return false;">
<span class="fa fa-print"></span> Print</button>
<button class="pdf-download btn btn-xs btn-primary"
onclick="$('.viz-params-more').find('[data-arc-imageformat="pdf-current"]')[0].click();”>
<span class="fa fa-download"></span> Download PDF</button>
<div class="image-dropdown-submenu"></div>
</div>When you add this extension visual to the dashboard, it would look similar to this (in View mode).
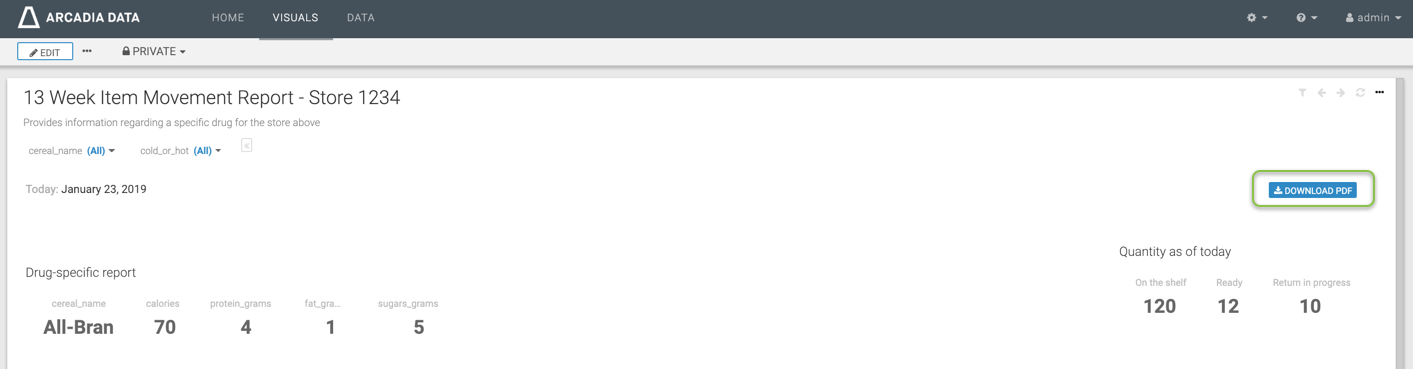
Create the Table Visual
Create and customize the main table visual. Note that this visual should be the last (lowest) one in the dashboard.
- Create the table visual on the target dataset, as described in Table Visuals.
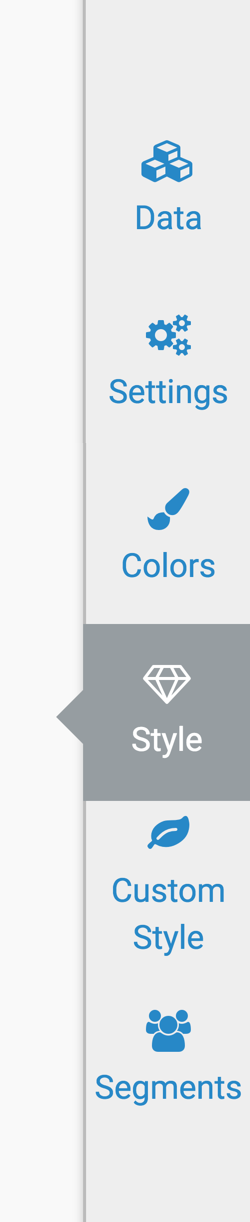
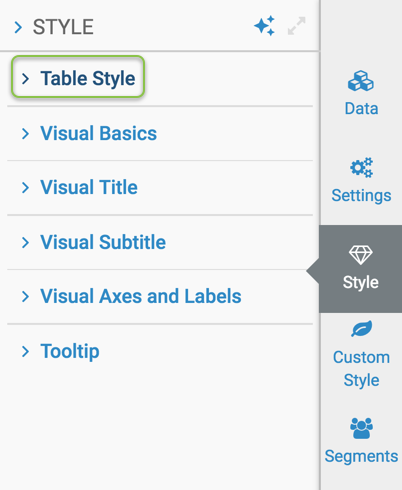
On the right side of Visual Designer, click the Style menu.
In the Style menu, click Table Style.
-
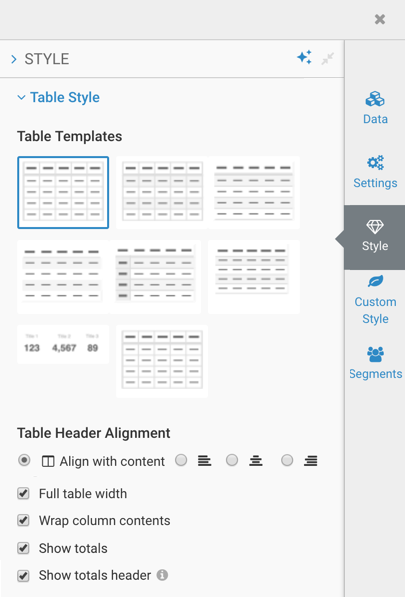
In the Table Style menu, make the following selections and changes:
- Choose the first table template
- Table Header Alignment set to Align with contents
- Enable Full Table Width
- Wrap Column Contents
Switch to the Custom Style menu, and make the following changes:
- Add the style arc-print-last-table to the visual, as described in Adding Custom Styles to Visuals.
-
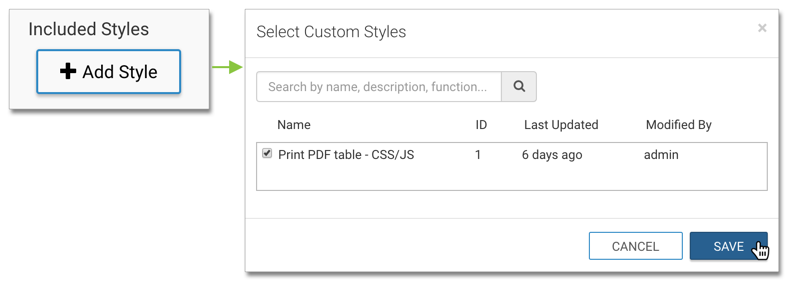
Add the style we created earlier, Print PDF table - CSS/JS, to the visual, as described in Adding Included Styles to Visuals.
Note that the ID of your custom style may be different. Arcadia Enterprise generates sequential ID on each instance.
Your Custom Style menu selections should look something like this:
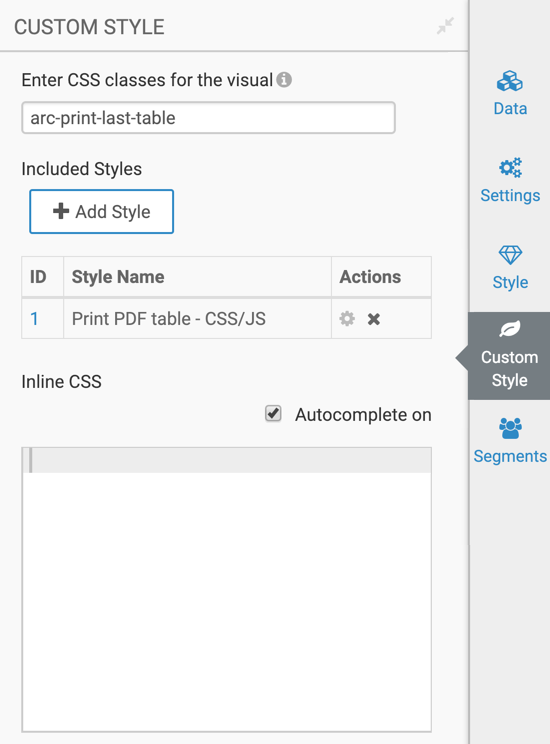
-
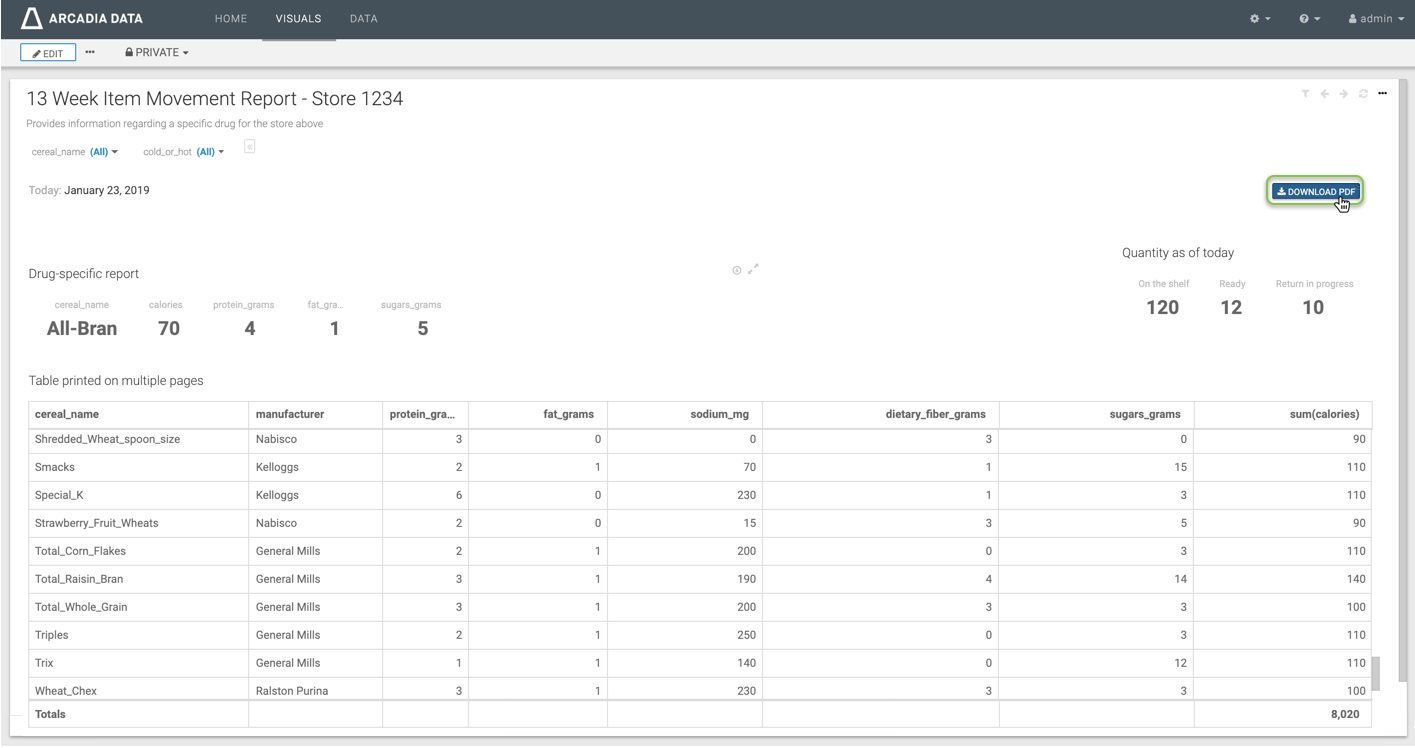
When you finished configuring the table, it would look similar to this in View mode of the dashboard. Ensure that this table visual is the last item on the dashboard.
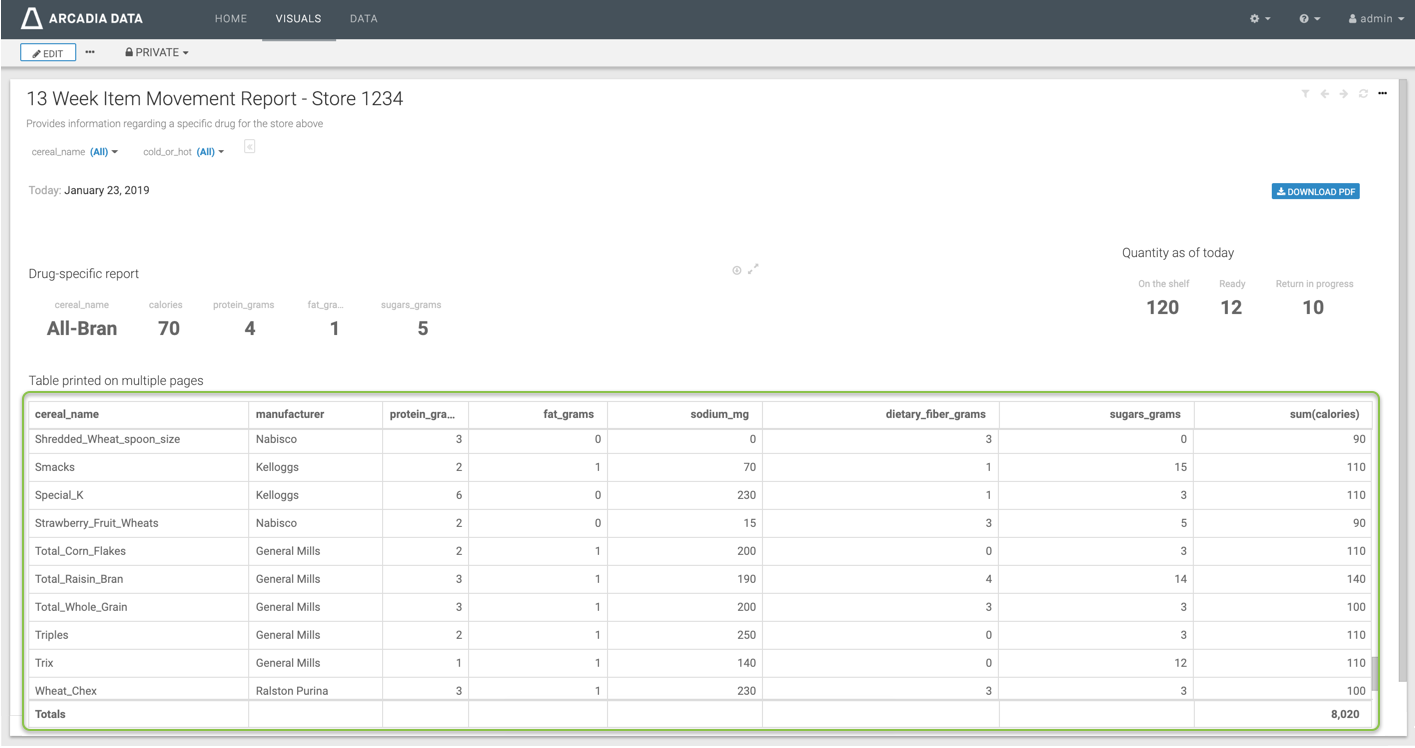
Dashboard with Large Table Visual
Print and Download
After saving the dashboard, switch to View mode.
Click the Print button on the dashboard, and then follow system prompts to complete the printing process.
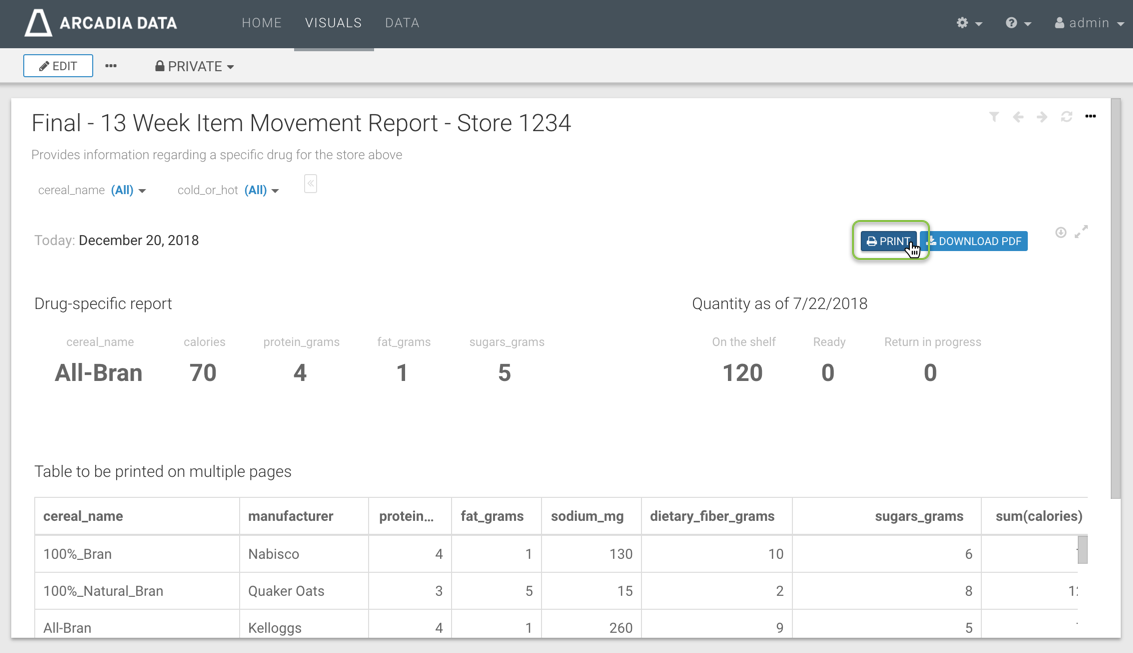
Click the Download PDF button on the dashboard, and then follow system prompts to complete the PDF download of the dashboard.